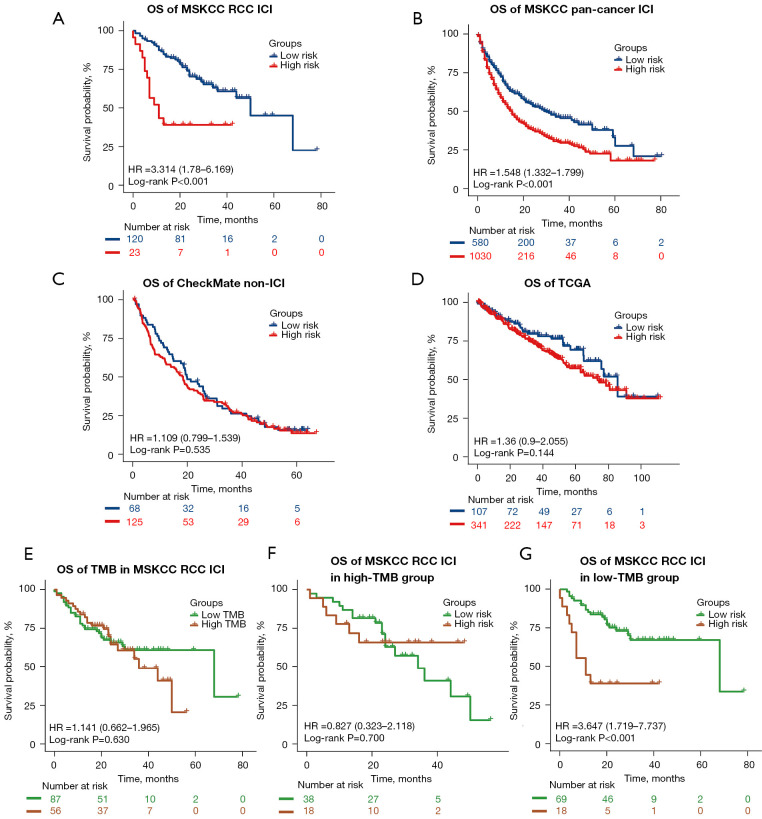
Figure 4.
External validation of the mutation classifier in the ICI therapy and non-ICI therapy cohorts. Kaplan-Meier curves show the differences in OS between the low- and high-risk groups in the (A) MSKCC advanced RCC ICI therapy cohort, (B) MSKCC pan-cancer ICI therapy cohort, (C) CheckMate non-ICI therapy cohort, and (D) TCGA cohort. (E) Kaplan-Meier curves of OS in the MSKCC advanced RCC ICI therapy cohort according to TMB. (F,G) Kaplan-Meier curves of OS in patients from the high- and low-TMB groups in the MSKCC advanced RCC ICI therapy cohort. OS, overall survival; RCC, renal cell carcinoma; ICI, immune checkpoint inhibitor; HR, hazard ratio; MSKCC, Memorial Sloan Kettering Cancer Center; TCGA, The Cancer Genome Atlas; TMB, tumoral mutation burden.

