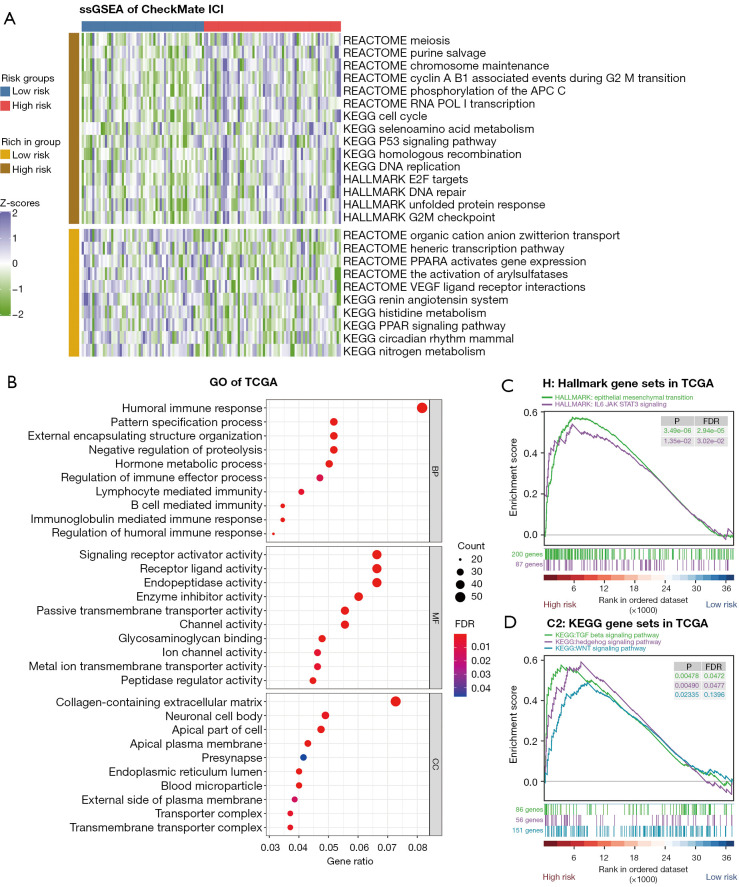
Figure 5.
Pathway enrichment and gene function analyses between the low- and high-risk groups. (A) Heatmap for ssGSEA comparing the enrichment scores of different pathways between the 2 risk groups in the CheckMate ICI therapy cohort. Only pathways with P<0.05 in the Wilcoxon rank-sum test a displayed. (B) Bubble graph for GO enrichment based on the DEGs between the 2 risk groups in TCGA cohort (a bigger bubble indicates more genes are enriched, and a deeper shade of red indicates a more obvious difference). (C,D) GSEA of patients with RCC in TCGA cohort based on the mutation classifier. ssGSEA, single-sample gene set enrichment analysis; ICI, immune checkpoint inhibitor; GO, Gene Ontology; DEG, differentially expressed gene; TCGA, The Cancer Genome Atlas; BP, biological process; MF, molecular function; CC, cell component; GSEA, gene set enrichment analysis; RCC, renal cell carcinoma; FDR, false discovery rate.

