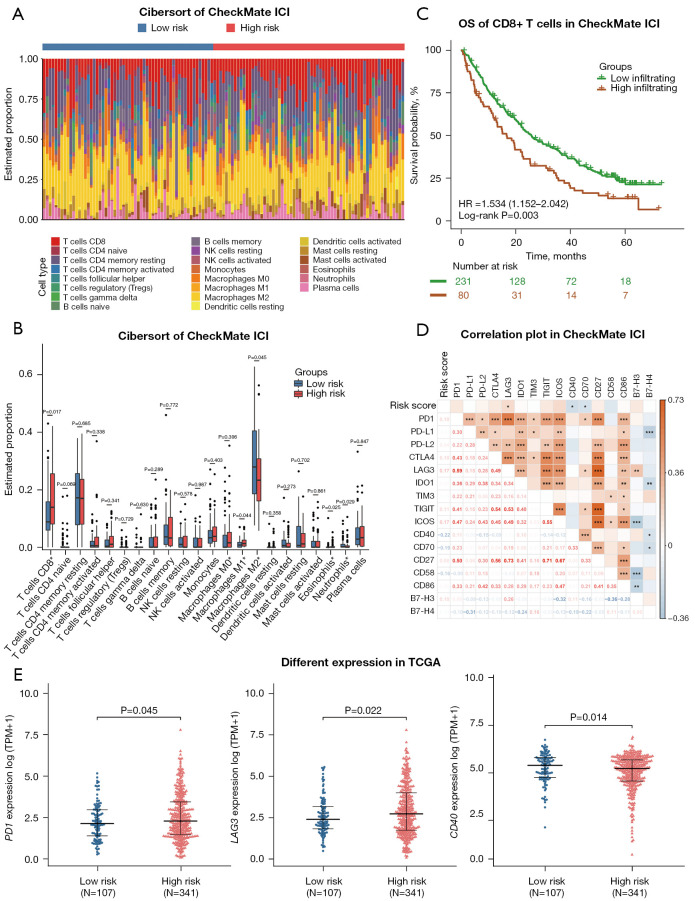
Figure 6.
Distribution of immune infiltration cells and gene expressions of immune checkpoint molecules associated with the mutation classifier. (A) The risk groups and proportions of 22 tumor-infiltrating immune cells in the CheckMate ICI therapy cohort. (B) Bar plot showing the different proportions of 22 tumor-infiltrating immune cells between the low- and high-risk groups in the CheckMate ICI therapy cohort. (C) Kaplan-Meier curves of OS in the CheckMate ICI therapy cohort according to CD8+ T-cell infiltration. (D) Correlation heatmap of the risk score and expressions of 16 immune checkpoint genes. *, P<0.05; **, P<0.01; ***, P<0.001. (E) The expression levels of immune checkpoint genes between the low- and high-risk groups in TCGA cohort. ICI, immune checkpoint inhibitor; OS, overall survival; HR, hazard ratio; TCGA, The Cancer Genome Atlas; TPM, transcripts per million.

