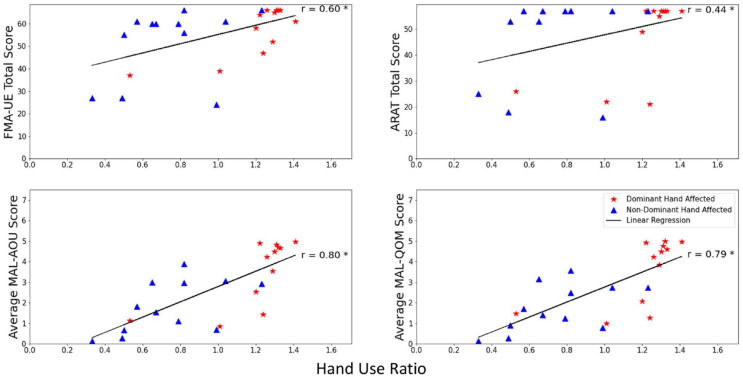
Figure 3.
Scatterplot of the hand use ratios and the total scores of the Fugl-Meyer Assessment for Upper Extremity (FMA-UE, r = .60), the Action Research Arm Test (ARAT, r = .44), the Amount of Use (AoU, r = .80), and the Quality of Movement (QoM, r = .79) of the Motor Activity Log-30 (MAL). Linear regression lines are shown since significant Spearman’s correlations were found with the assessments.

