Figure 1.
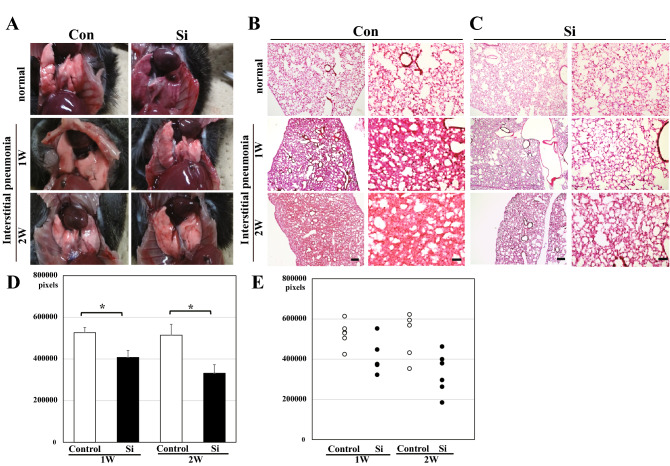
Gross pathology of the lung (A) and pathologic analysis using HE-stained lung specimens (B–E). (A) The representative photographs of the lung in the normal mice (upper panel) and IP mouse models treated with MTX for 1 week (middle panel) and 2 weeks (bottom panel). Left panel: Con group or Con-IP group; right panel: Si group or Si-IP group. (B,C) The representative microphotographs of the HE-stained lung in the normal mice (upper panel) and IP mouse models treated with MTX for 1 week (middle panel) and 2 weeks (bottom panel). (B) Con group or Con-IP group (C) Si group or Si-IP group. Left panel: low magnification; right panel: high magnification. Scale bar 200 µm (B,C: left); 100 µm (B,C: right). (D,E) The measured results of interstitial area in the lung. (D) Bar chart indicates the mean values. (E) The dot graph indicates the individual values. White: Control group. Black: Si-based agent group. MTX administration for 1 week (left pair graph) and 2 weeks (right pair graph). Data are expressed as mean. SEM of eight mice per group. **p < 0.01 vs. Control group, determined by Student’s paired t-test.

