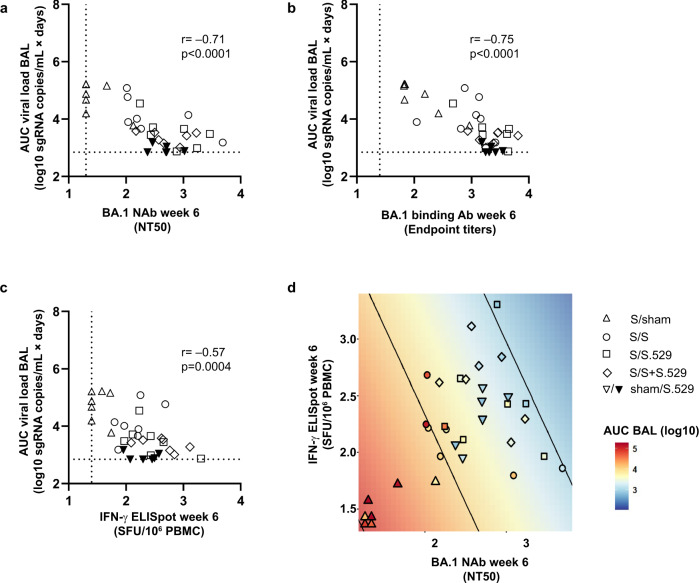
Fig. 6. Correlates of protection analysis.
Correlations of week 6 a Omicron BA.1 neutralizing antibodies, as measured by psVNA (NT50); b Omicron BA.1 binding antibodies, as measured by ELISA (endpoint titers); and c Omicron BA.1 T cell responses, as measured by IFN-γ ELISpot (SFU/106 PBMC) with AUC viral load (sgRNA copies/mL × days) in BAL samples. The control group that underwent sham immunization and sham boosting is not included. Dotted lines indicate the LLOD for each assay. Correlations were assessed by two-sided exact Spearman rank correlation tests. d Regression of log10 AUC BAL sgRNA on log10 Omicron BA.1 pseudovirus neutralizing antibody titer and log10 T cell responses. In the figure, the symbols indicate the AUC BAL sgRNA of each NHP as color and their treatment group as shape against a colored background, with contours corresponding to the fitted regression model. For all 4 panels (a–d), the different symbols indicate the different immunization regimens, as indicated in the legend in panel d with Ad26.COV2.S indicated as “S” and Ad26.COV2.S.529 indicated as “S.529”. For all panels, n = 7 animals per group except for the Sham-S.529 group where n = 6 animals. Source data are provided as a Source Data file. Ab antibody, AUC area under the curve, BAL bronchoalveolar lavage, ELISA enzyme-linked immunosorbent assay, ELISpot enzyme-linked immunospot assay, IFN-γ interferon gamma, LLOD lower limit of detection, NAb neutralizing antibody, NHP nonhuman primate, NT50 50% neutralization titer, PBMC peripheral blood mononuclear cell, psVNA pseudovirus neutralization assay, S spike, SFU spot-forming units, sgRNA subgenomic RNA.

