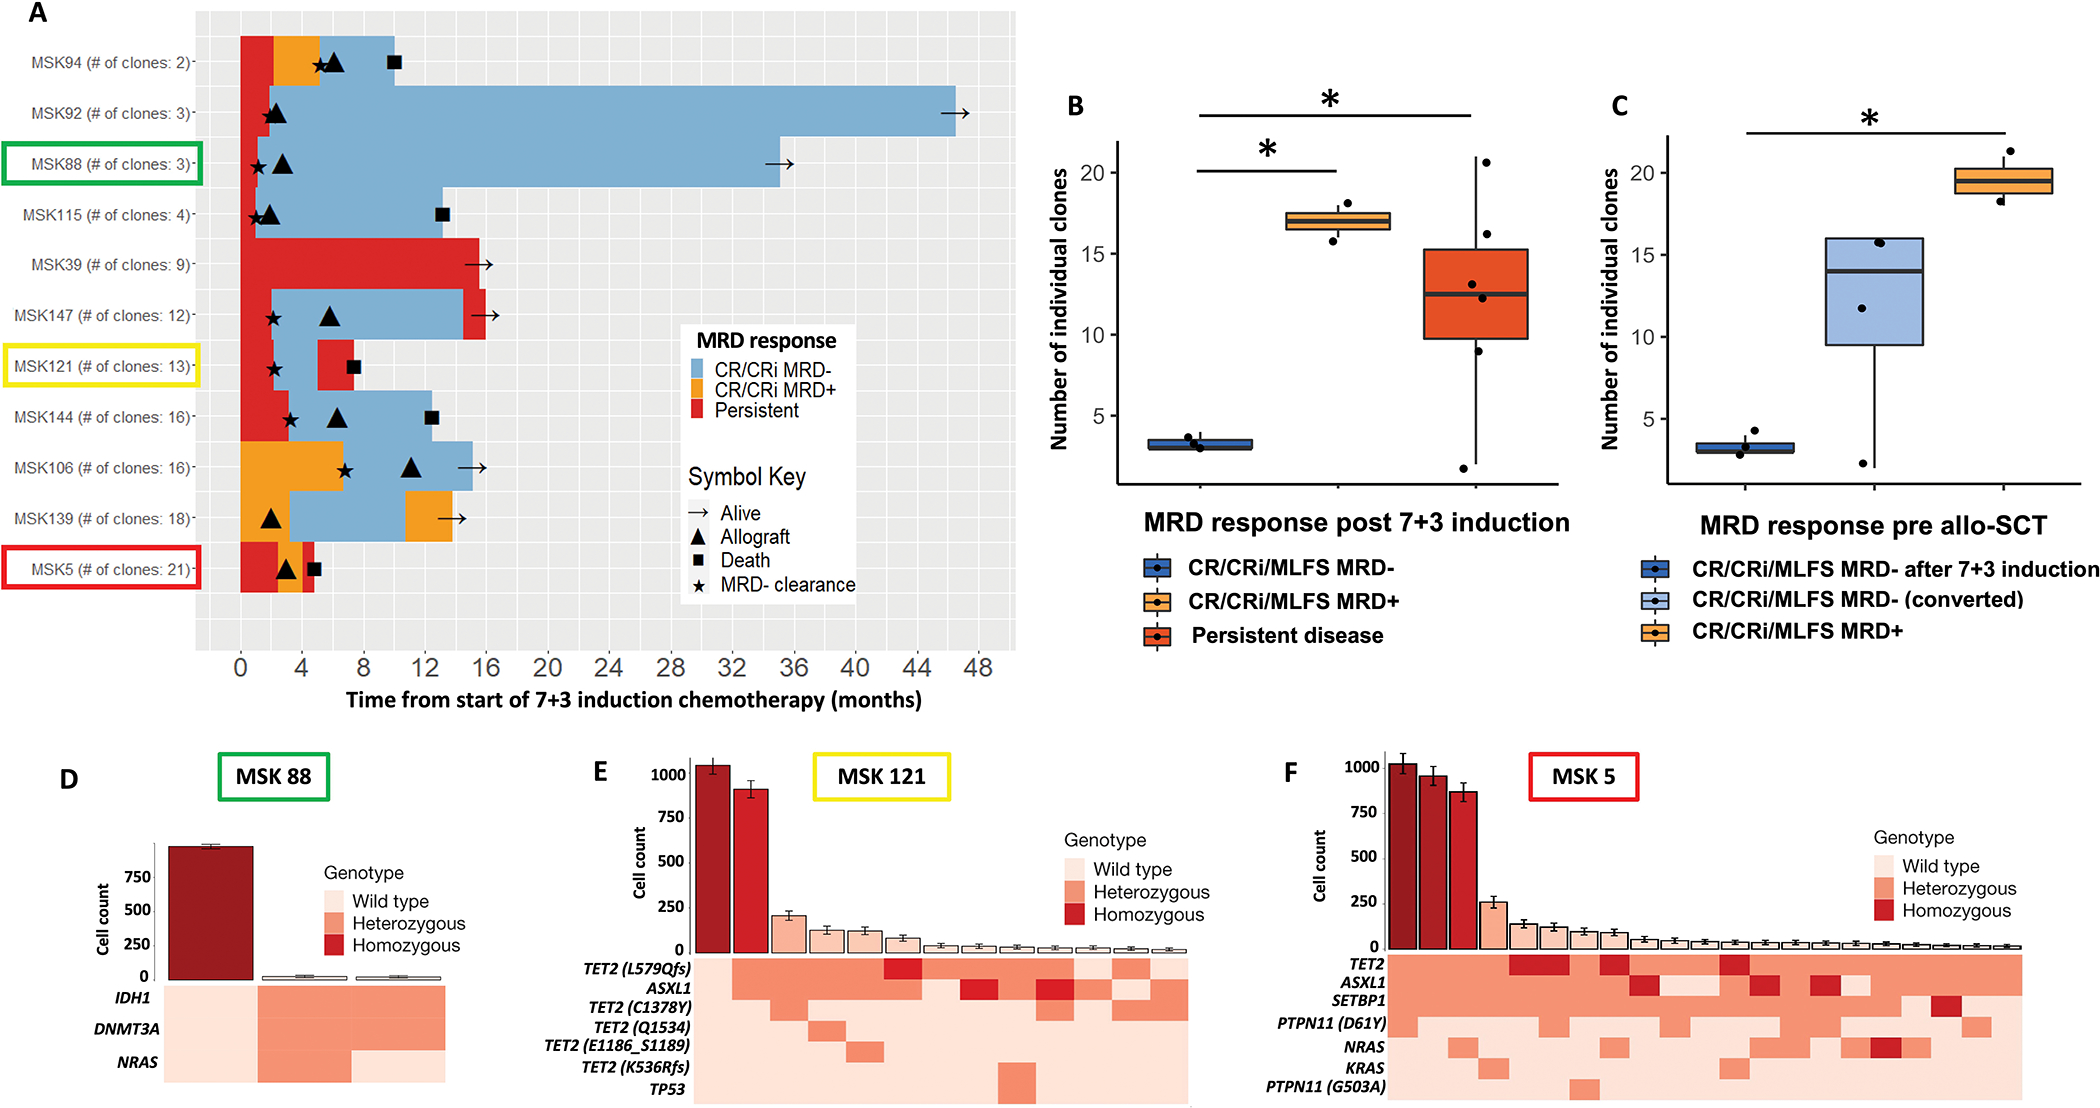
Figure 3: Impact of clonal diversity on MRD response on the single cell level.

(A) Swimmer’s plot showing clonal diversity as estimated by the number of individual clones prior to starting 7+3 (as assessed by single cell analysis) and tracking MRD clearance with treatment over time. Patients are ordered by number of individual clones lowest to highest.
(B-C) Impact of clonal diversity as assessed by the number of individual clones at time of diagnosis on MRD clearance. (B) MRD clearance rates (based on pre-treatment number of individual clones) with induction chemotherapy including patients with MRD−, MRD+ and persistent disease after induction chemo. (C) MRD clearance rates (based on pre-treatment number of individual clones) prior to allo-SCT including patients with early MRD− after induction chemo, converted MRD− after additional therapy and MRD+ disease pre allo-SCT.
(E-F) Representative clonal repertoire for a patient with low clonal diversity (E: MSK 88) in contrast to two patients with high clonal diversity (F: MSK 5 and G: MSK121), respectively. The top panel shows the number of cells (mean ± 95% confidence intervals (CI)) identified with a given genotype and ranked by decreasing frequency. The bottom panel shows a heat map indicates mutation zygosity for each clone.
