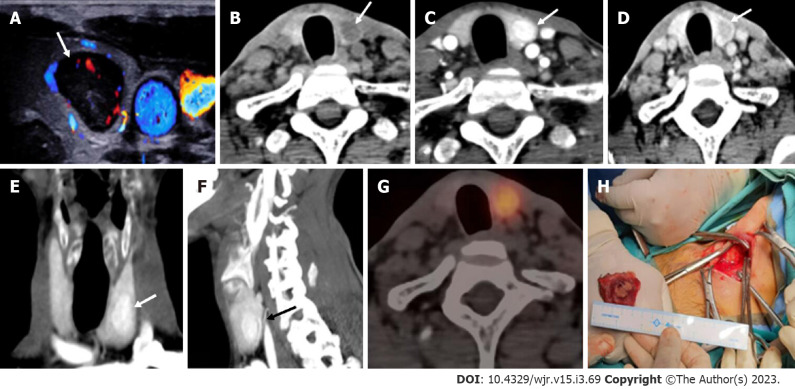
Figure 11.
Intrathyroidal parathyroid adenoma. In a patient with raised parathormone (208 IU), A: Color doppler ultrasound of the neck showed a circumscribed solid hypoechoic lesion within the left lobe of thyroid gland; B: 4-dimensional computed tomography revealed the lesion to be hypodense as compared to thyroid tissue on non-contrast; C: showed intense arterial hyperenhancement; D: Washout on the venous phase, consistent with the diagnosis of intra-thyroid parathyroid adenoma; E and F: Coronal (E) and Sagittal maximum intensity projection images better depict the lesions with vascular pedicle (black arrow) seen supplying the lesion (F); G: Single photon emission computed tomography image showing a thyroid nodule which is mildly tracer avid; H: Left hemithyroidectomy was done and the cut open section confirmed the presence of the tumor.

