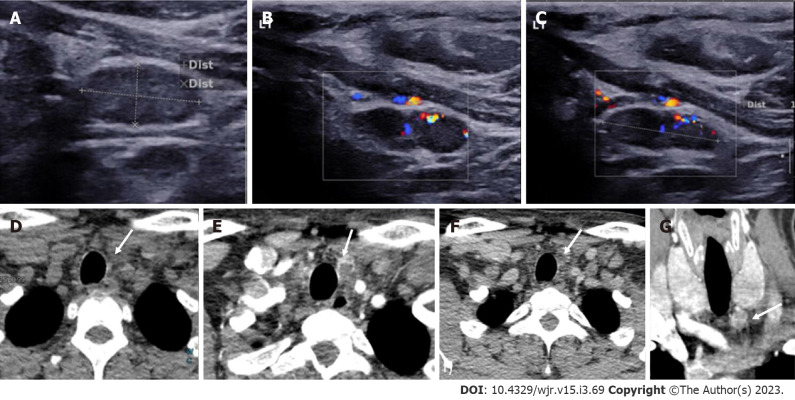
Figure 7.
Left inferior parathyroid adenoma. In a patient with raised parathormone levels (290 IU), grey scale ultrasound A: and colour doppler flow imaging; B and C: Showed a hypoechoic lesion with vascularity just below the left lobe of the; D: 4-dimensional computed tomography showed the lesion to be hypodense on noncontrast computer tomography; E: Hyperenhancing with central necrosis on arterial phase; F: Washout on the venous phase; G: Coronal image better demonstrates the lesion.

