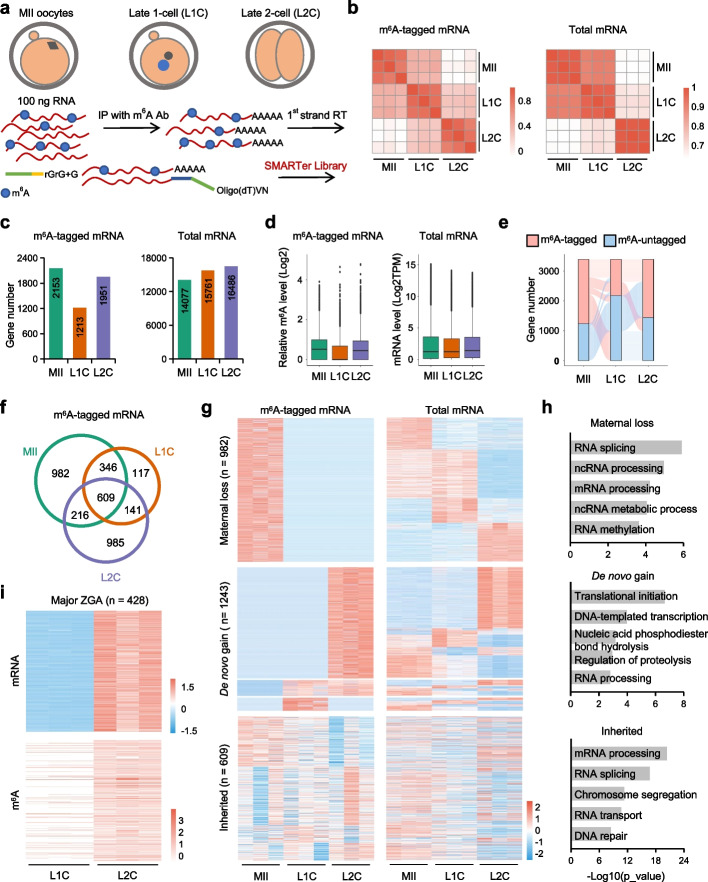
Fig. 1.
Comprehensive m6A landscape during mouse MZT. a Schematic diagram of sample collection and SLIM-seq procedure. b Heatmap showing the pairwise correlations of m6A and mRNA expression profiles. c The numbers of m6A-tagged mRNAs and total mRNAs in different stages. d Boxplot plots displaying the log2 normalized m6A levels and mRNA expression levels in different stages. e The Sankey diagram showing the dynamics of m6A tagged mRNAs. Red represents the gene defined as m6A-tagged mRNAs cross different stages of MZT. f Venn diagram showing overlapping of m6A tagged genes from different stages. g Heatmap showing normalized m6A levels and the corresponding mRNA expression levels in different stages. h Gene ontology (GO) enrichment analysis of three types of the m6A tagged genes. For maternal loss, 453 genes with decrease at both m6A and mRNA levels are used for analysis. For de novo gain, 628 genes with increase at both m6A and mRNA levels are used for analysis. i Heatmap showing normalized m6A levels and the corresponding mRNA expression levels in ZGA

