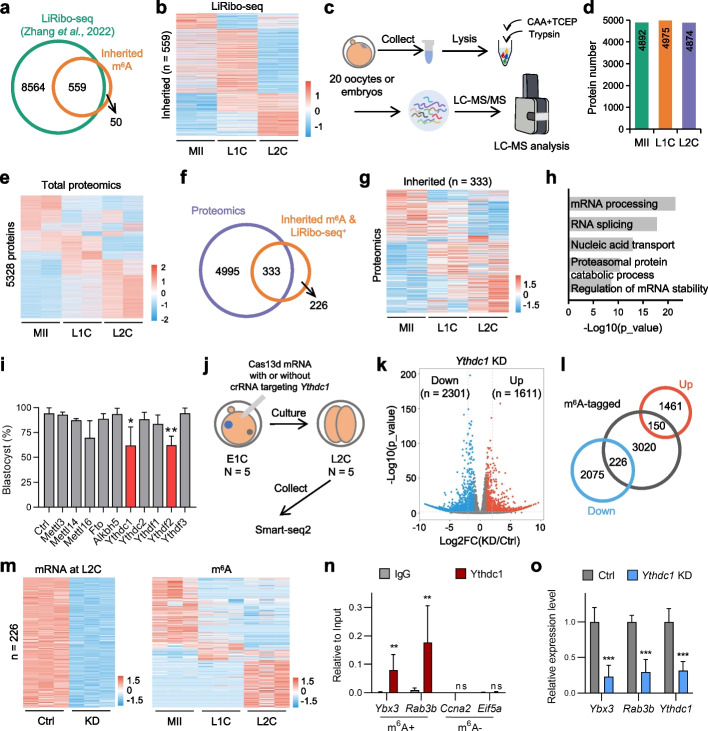
Fig. 2.
A group of maternally inherited m6A maintains mRNA stability and relates to protein translation. a Venn diagram showing overlap between LiRibo-seq detected genes and inherited m6A-tagged genes. b Heatmap showing the relative gene expression levels by LiRibo-seq that overlapped with inherited m6A tagged genes. c Workflow of low-input proteomic analysis. 20 oocytes or embryos were pooled and transferred into low adsorption tube, then lysed, digested, and analyzed by ultra-sensitive LC–MS/MS. Both hybrid spectral library and final DIA (data-independent acquisition) data were generated by Spectronaut™. d The number of protein groups detected in different stages. e Heatmap showing the relative protein expression levels in different stages. f Venn diagram showing the overlap between LiRibo-seq detected genes and proteins identified by proteomic data in oocytes and preimplantation embryos. g Heatmap showing the relative expression levels of 333 proteins detected by MS. h GO enrichment analysis of genes shown in (G). i Blastocyst ratios in the control and the indicated gene knockdown groups. Ctrl represents Cas13d mRNA only. Data represent the mean ± standard deviation (SD) of three biologically independent experiments (two-tailed Student’s t-test). **P < 0.01, *P < 0.05. j Schematic diagram of sample collection and processing. E1C, early 1-cell. k Volcano plot displaying the DEGs between Ctrl and Ythdc1 KD groups at L2C stage. The DEGs are identified with P value < 0.05 and absolute log2 fold-change > 1. l Venn diagram showing the overlap between DEGs and the m6A-tagged genes. m Heatmaps showing the relative expression levels of downregulated genes from m6A-marked genes after Ythdc1 KD (left) and their corresponding m6A levels (right). n RIP-qPCR showing Ythdc1 associated m6A-tagged mRNAs. Obtained signals were normalized to the Input. IgG and m6A-untagged genes served as negative controls. Data represent the mean ± SD of three biologically independent experiments (two-tailed Student’s t-test). **P < 0.01, ns denotes not significant. o qRT-PCR results of indicated mRNAs that immunoprecipitated with Ythdc1 after Ythdc1 KD. Ythdc1 was measured to verify the KD efficiency. Obtained signals were normalized to Actb, and were relative to Ctrl. Data represent the mean ± standard deviation of three biologically independent experiments (two-tailed Student’s t-test). ***P < 0.001

