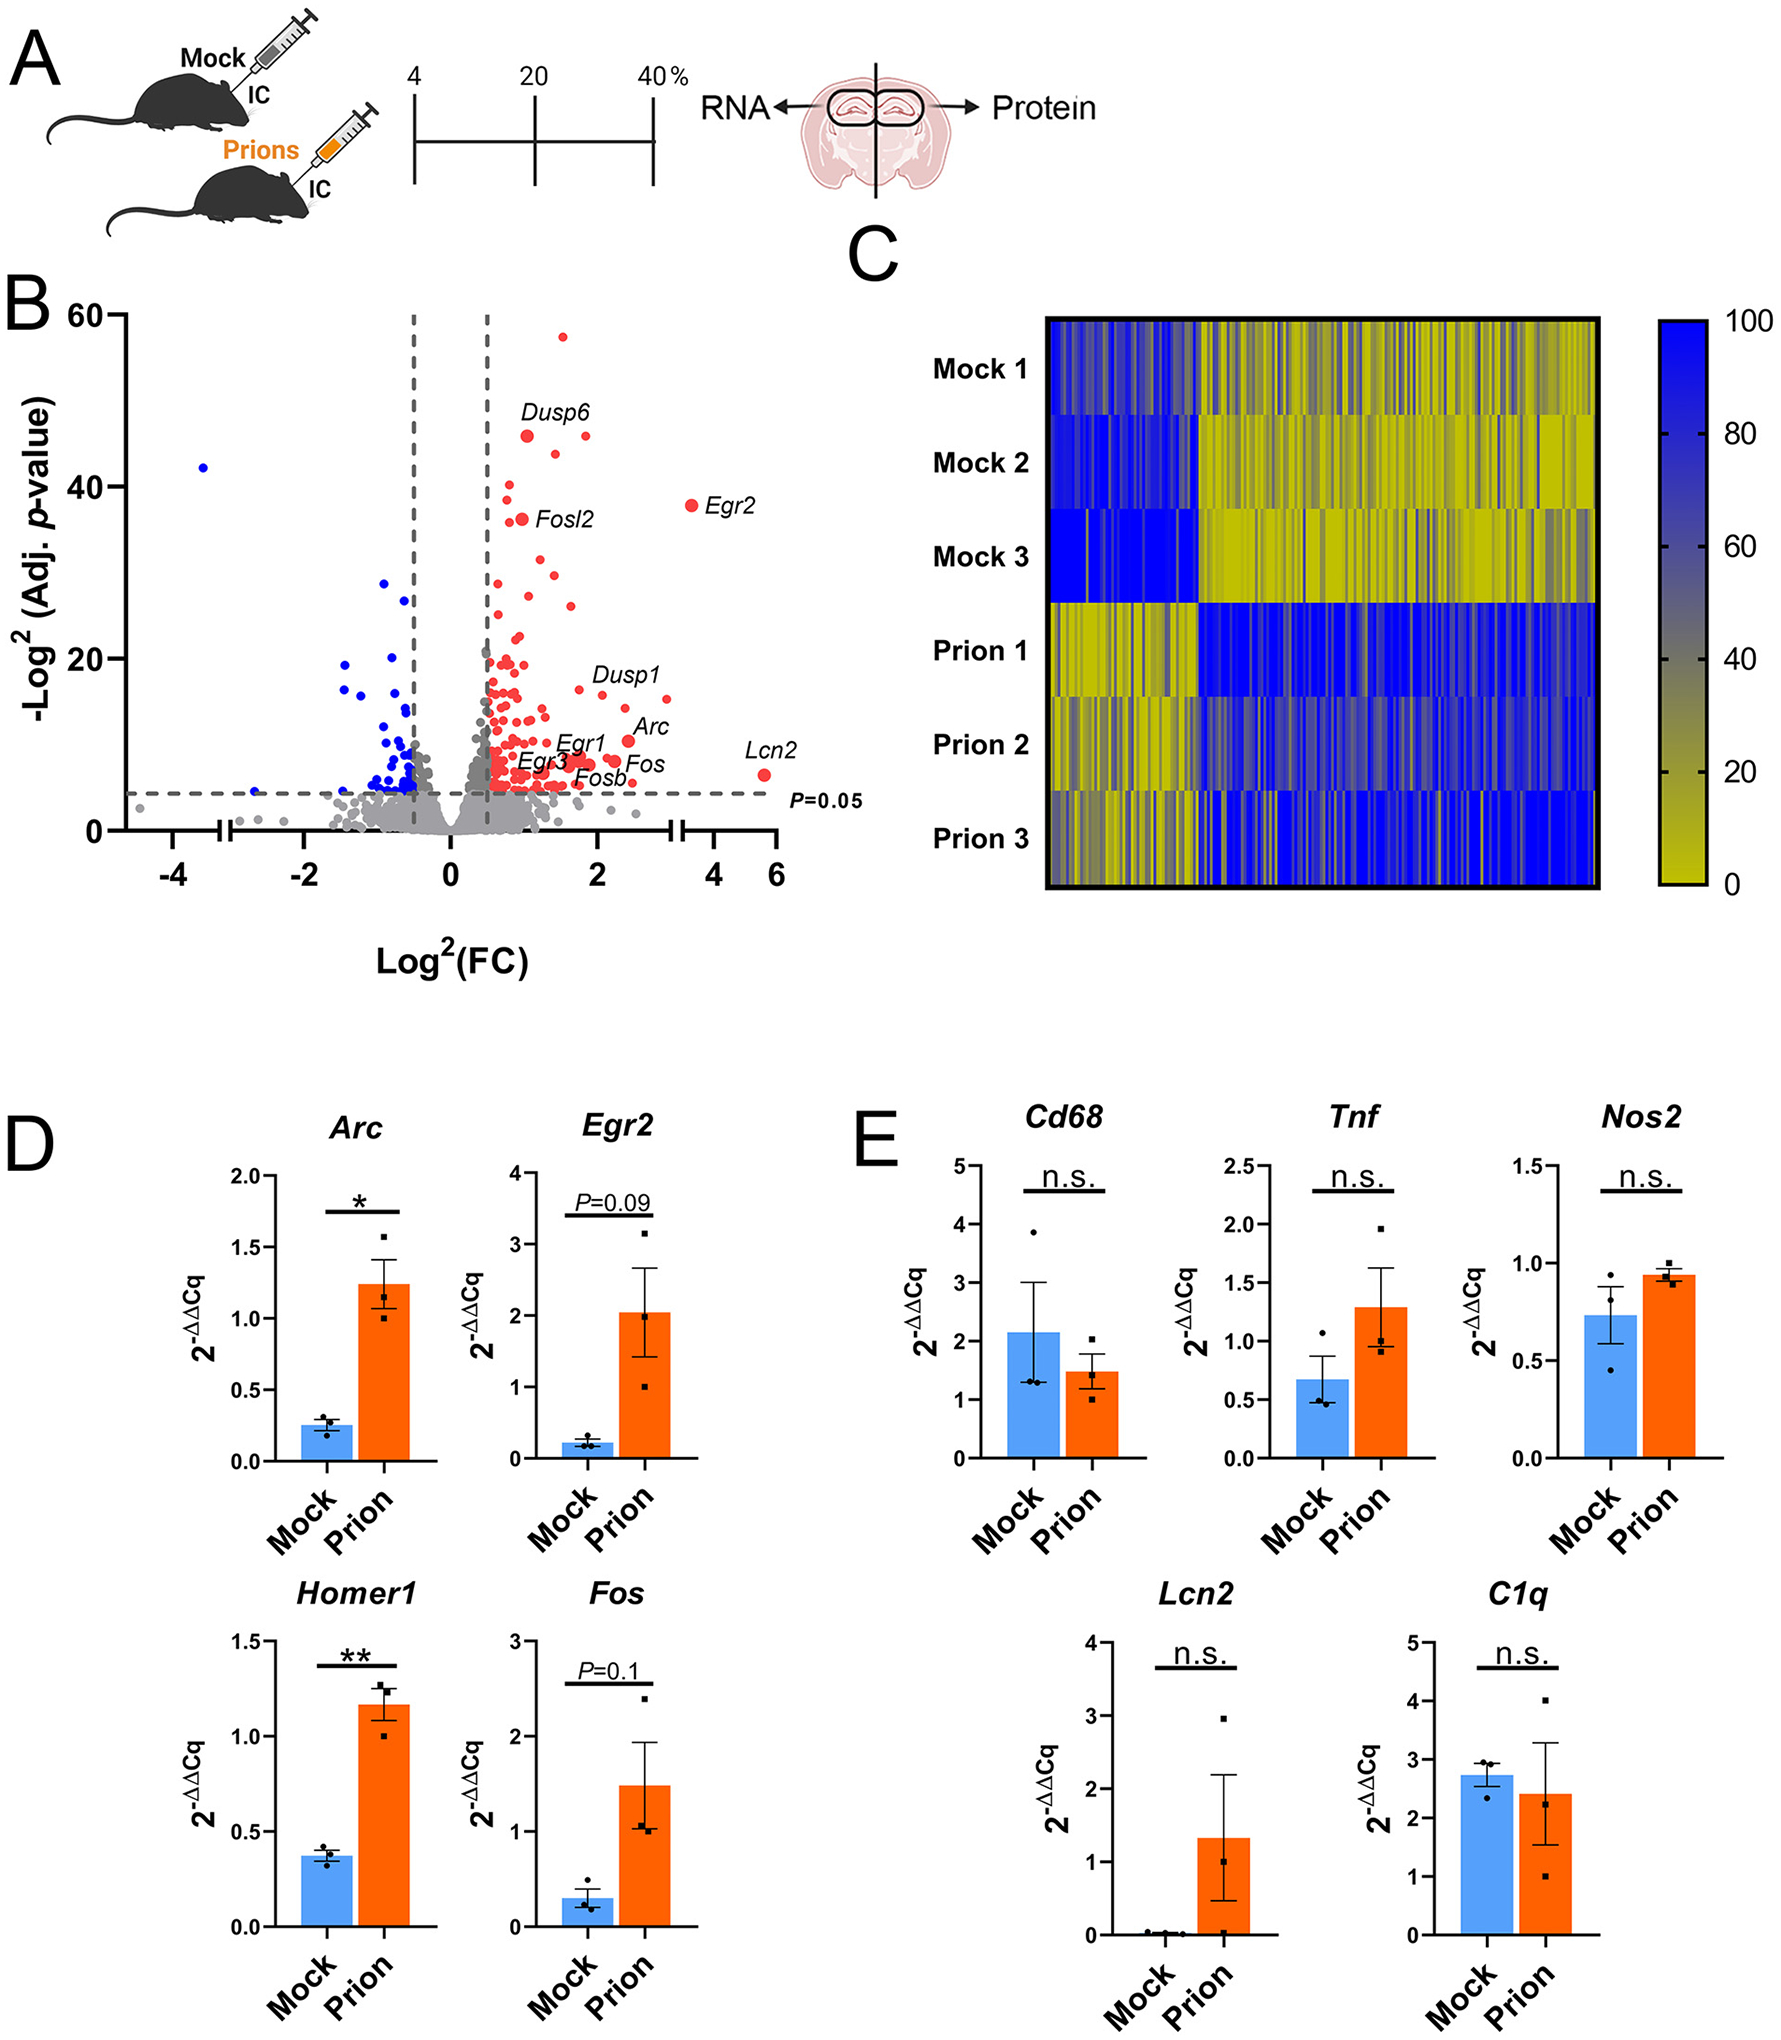
Fig. 2.

Profiling hippocampal transcripts in mock- and prion-inoculated mice reveals an early increase in immediate early genes. (A) Schematic shows the 40% time point when mock- or prion-inoculated hippocampi were isolated for RNA and protein analysis. (B) Volcano plot shows genes in prion-inoculated hippocampi that significantly differ from mock-inoculated hippocampus. (C) Heat map of genes significantly altered in prion-infected animals. Genes were lane normalized to improve visualization of changes. Within each lane, highest value = 100, lowest value = 0. (D, E) qRT-PCR for IEG genes (D), and inflammation-associated genes (E). n = 3 male mice per group. Welch’s t-test, *P ≤ 0.05; **P ≤ 0.01; ***P ≤ 0.001.
