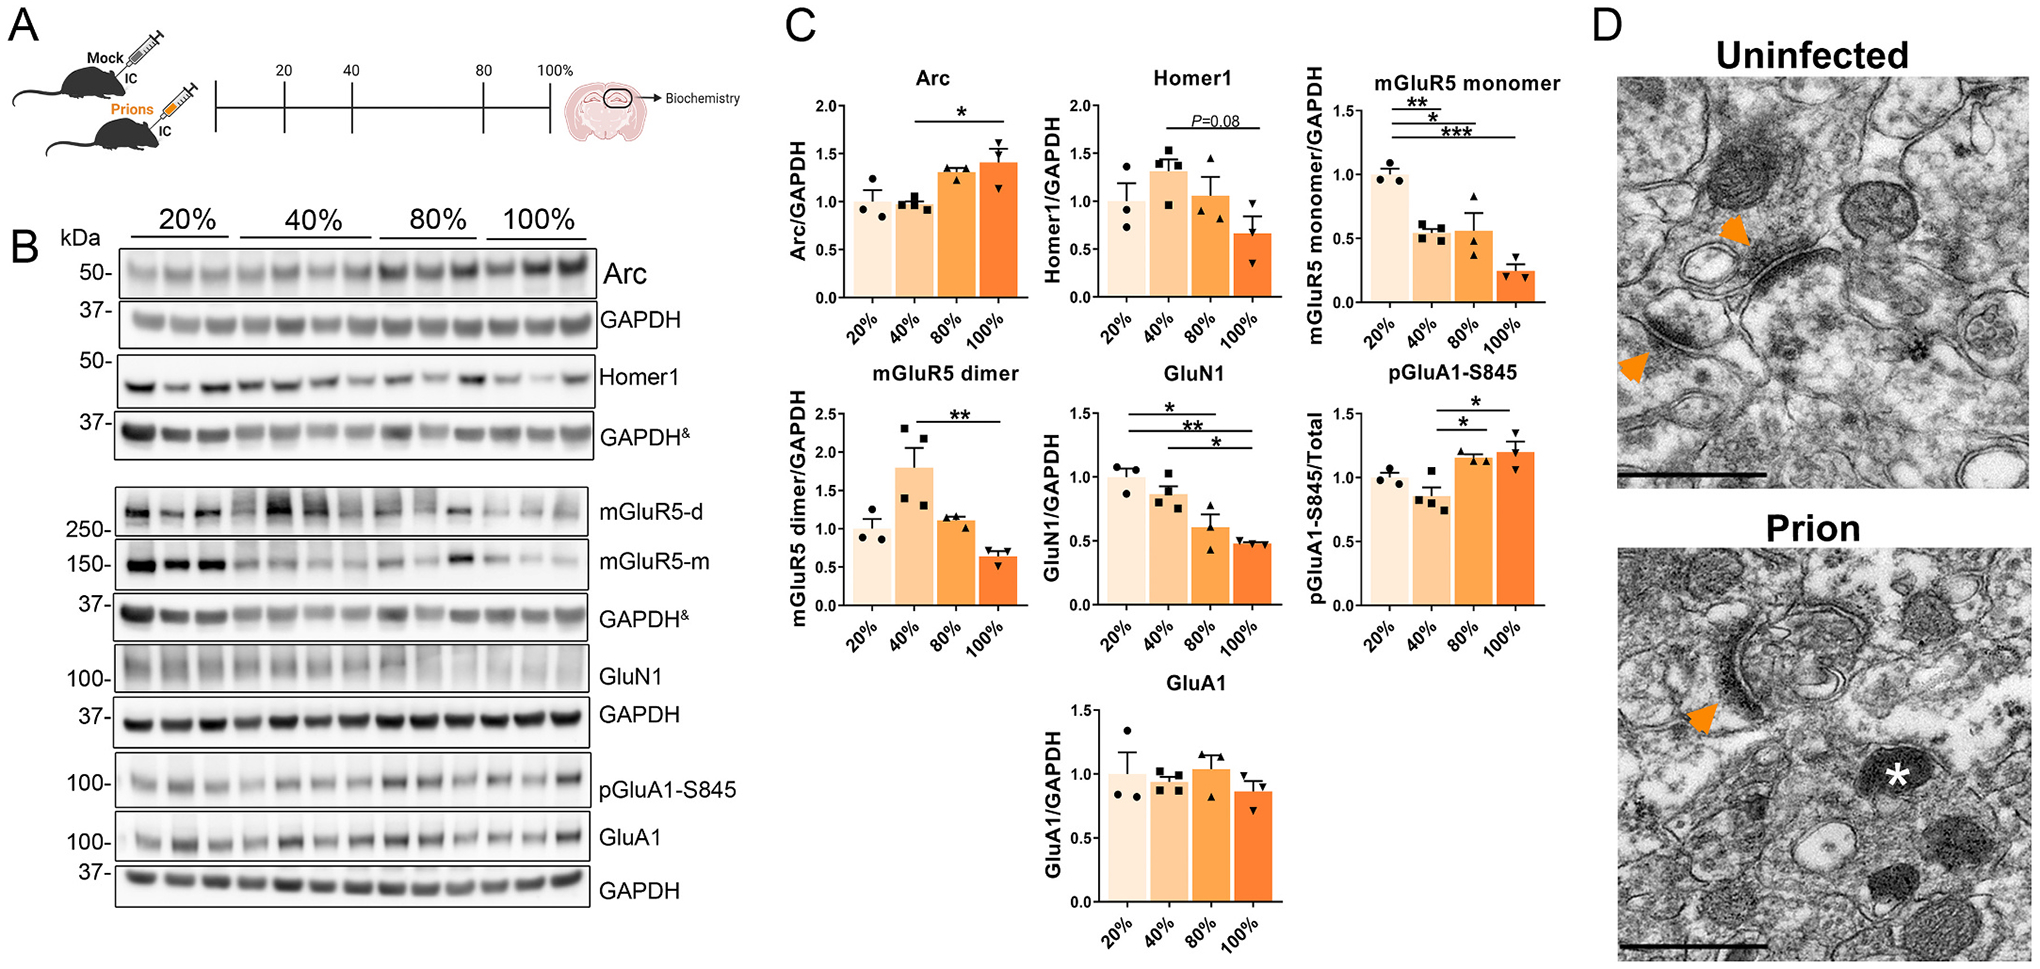
Fig. 4.

Longitudinal study of IEGs and synaptic proteins in the prion-infected hippocampus. (A) Schematic shows the four timepoints used to interrogate disease-associated protein alterations in the brain. (B, C) Western blot and quantification of IEGs and synaptic proteins, including receptors (mGluR5, GluN1, and GluA1). & indicates the same GAPDH loading controls for proteins immunoblotted on the same membrane. n = 3 – 4 male mice per group, One-way ANOVA and Tukey HSD post hoc test; *P ≤ 0.05; **P ≤ 0.01; ***P ≤ 0.001. (D) TEM images of the CA1 region of the hippocampus, arrowheads = post synapse density; * = lysosome, scale bar = 500 nm.
