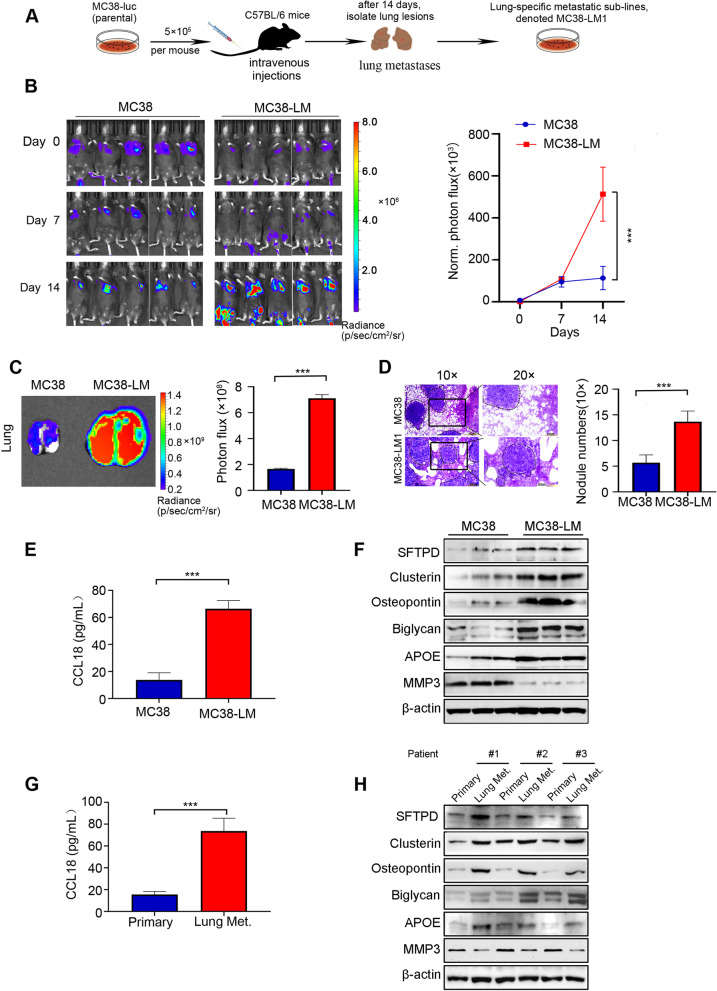
Fig. 6.
Expression levels of hub genes in primary and lung metastatic colorectal cancer (CRC) cells or tissues. A Graphic illustration of in vivo-selected highly lung metastatic CRC cells. MC38-Luc (5 × 10⁵) cells were intravenously injected into the C57BL/6 mice. After two weeks, a single lung metastatic nodule was isolated, dissociated and expanded to culture, yielding highly lung metastatic CRC cells, named MC38-Luc-LM. B Left, 5 × 10⁵ primary or lung metastatic MC38-Luc cells were intravenously injected into C57BL/6 mice and bioluminescence imaging (BLI) was captured weekly. Right, quantification of BLI photon flux at the lung zones of mice was conducted weekly. C Representative images and quantitative analysis of lung measured by BLI are shown on day14 after cell injection. D Representative images of H&E staining of lung and quantification of the lung metastatic nodules are presented. Scale bar: 200 µm (10 ×), 100 µm (20 ×). E The expression of CCL18 in the culture medium of primary and lung metastatic MC38-Luc cells detected by ELISA assay is shown. F The protein levels of SFTPD, Clusterin, Osteopontin, Biglycan, APOE and MMP3 in primary and lung metastatic MC38-Luc cells were examined by Western blotting assay. G The expression of CCL18 in the serum of primary and lung metastatic (Lung Met.) CRC patients detected by ELISA assay is shown. H The protein levels of SFTPD, Clusterin, Osteopontin, Biglycan, APOE and MMP3 in primary and lung metastatic (Lung Met.) patients with CRC were examined by Western blotting assay. For the results in (B-E) and (G), data were normally distributed and Student’s t test was used. ***, P < 0.001. Data are shown as means ± SD, n ≥ 3; A P < 0.05 was considered significant

