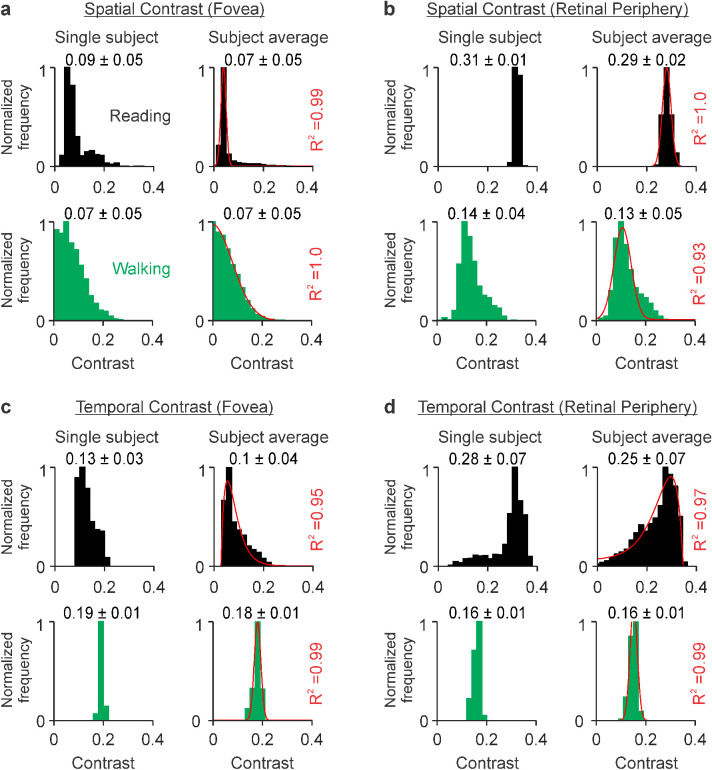
Figure 2.
Fovea–periphery differences in spatiotemporal contrast are more pronounced when reading black text on a white background than when walking. (a) RMS spatial contrast measured at the fovea of an example subject (left) and the average across subjects (right) during reading (black, top row) and walking (green, bottom row). The numbers on the top of each histogram are means ± standard deviations of spatial contrasts, which range from 0 to 1. The red lines are Gaussian fits (goodness of fit on the right). The [means, standard deviations] of the Gaussian fits are [0.038, 0.01] for reading and [0.003, 0.081] for walking. (b) Same as a, for visual periphery. The [means, standard deviations] of the Gaussian fits are [0.275, 0.017] for reading and [0.104, 0.034] for walking. (c) Same as a, for temporal contrast. The red lines are an Alpha fit for reading and a Gaussian fit for walking. The [mean, standard deviation] of the Gaussian fit are [0.177, 0.013]. (d) Same as b, for temporal contrast. The red lines are an Alpha fit for reading and a Gaussian fit for walking. The [mean, standard deviation] of the Gaussian fit are [0.145, 0.015].

