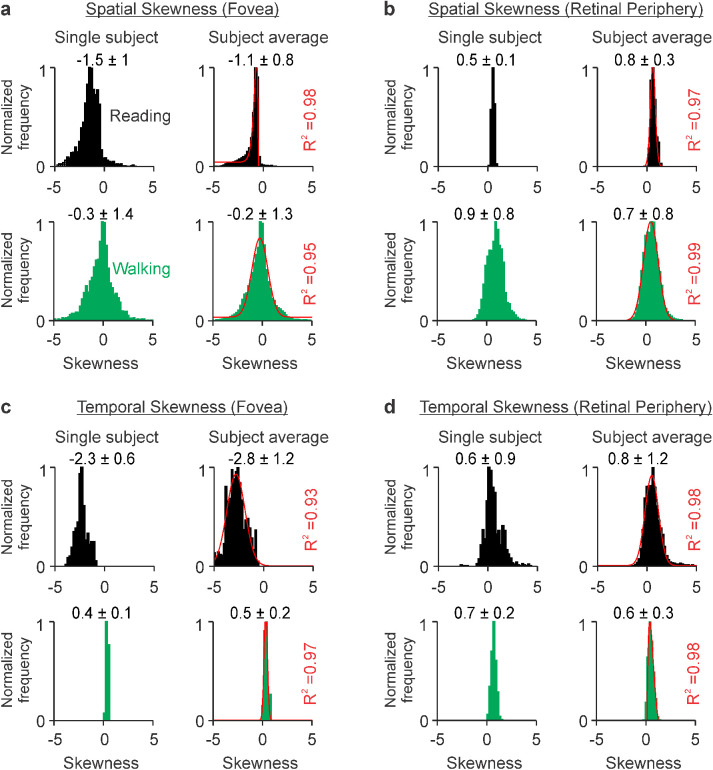
Figure 3.
Reading black text on a white background causes a pronounced bias toward dark contrasts in visual stimulation. (a) Spatial skewness measured at the fovea of an example subject (left) and the average across subjects (right) during reading (black, top row) and walking (green, bottom row). The format is the same as in Figure 2. The [raising, decaying] phases of the Alpha fit for reading are [−0.2, 1.0]. The [mean, standard deviation] of the Gaussian fit for walking are [−0.1, 0.9]. (b) Same as a, for visual periphery. The [means, standard deviations] of the Gaussian fits are [0.6, 0.3] for reading and [0.5, 0.7] for walking. (c) Same as a, for temporal skewness. The [means, standard deviations] of the Gaussian fits are [−2.8, 0.9] for reading and [0.3, 0.2] for walking. (d) Same as b, for temporal skewness. The [mean, standard deviation] of the Gaussian fit for reading are [−0.5, 0.7]. The [raising, decaying] phases of the Alpha fit for walking are [0.3, 1.3].

