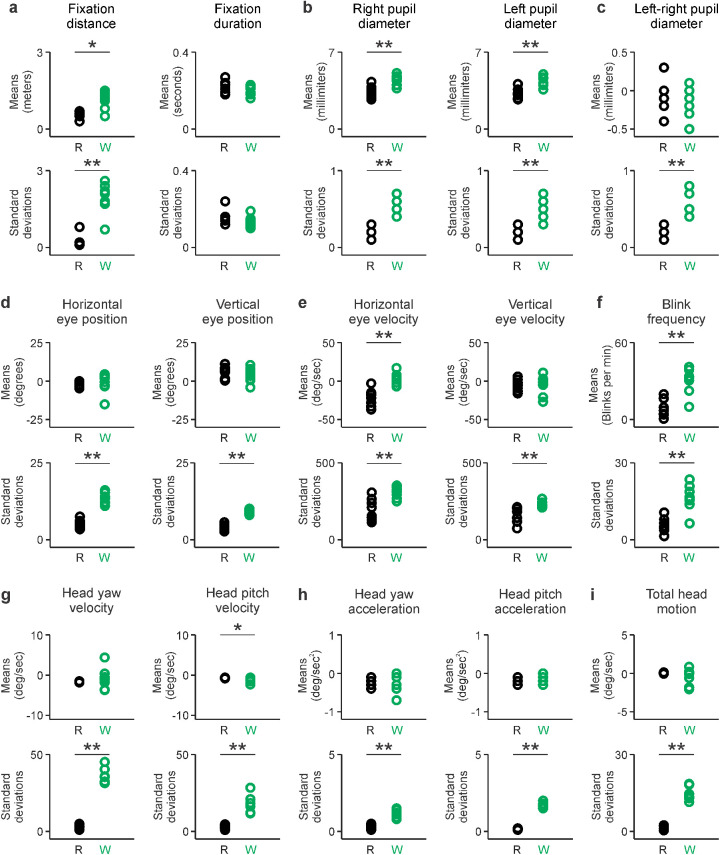
Figure 7.
Reading drives less variation in visuomotor activity than walking. (a) Means (top row) and standard deviations (bottom row) of fixation distance (left) and fixation duration (right). Same format for the other figure panels. (b) Right and left pupil diameters. (c) Left–right difference in pupil diameter. (d) Horizontal and vertical eye positions. (e) Horizontal and vertical eye velocities. (f) Blink frequency. (g) Head yaw and pitch velocities. (h) Head yaw and pitch accelerations. (i) Total head motion (average of head velocity across the three axes). *p < 0.05. **p < 0.01.

