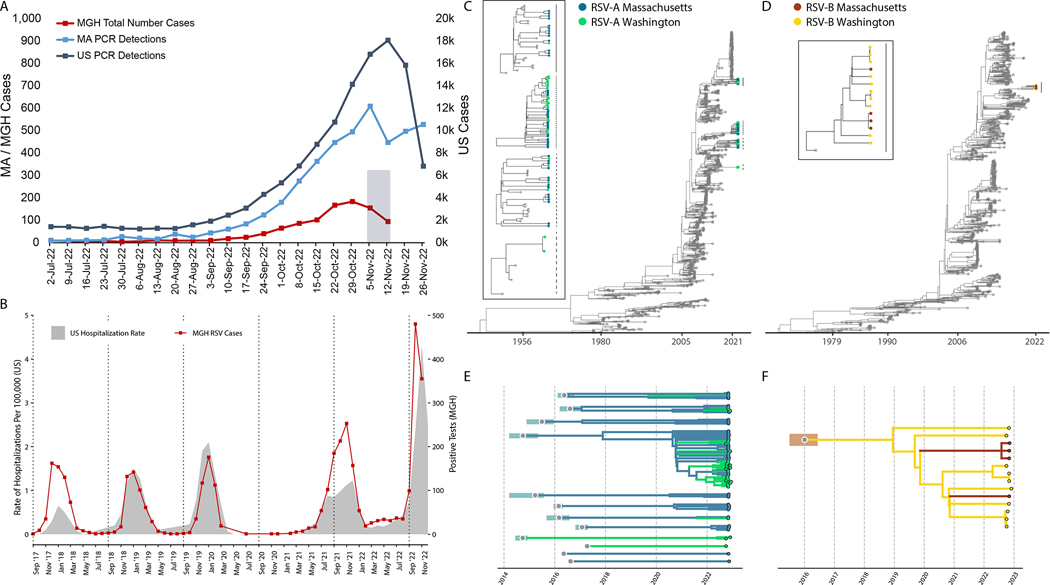
Figure 1: Epidemiological and genomic trends of the 2022 RSV surge.
A) The number of PCR positive tests for RSV reported by the CDC in MA (blue, left axis) and the US (slate gray, right axis), and the number of RSV positive tests conducted at MGH (red, left axis). The 105 sequenced samples were drawn from the Nov 2 - Nov 15 window (shaded gray box). B) RSV hospitalization rates for CDC RSV-NET (shaded gray) and MGH RSV cases (red) for 2017 – 2022. (Pearson r = 0.82; p < 0.0001 via permutation). C) Maximum likelihood tree of all RSV-A genomes (N=1,267; MA genomes in blue, WA genomes in green, others in gray). The tMRCA for 2022 RSV-A genomes was no later than 2008 (ML CI: 2008–04, 2008–09). In the box are zoomed in plots of the clades containing MA and WA with lines corresponding to clades on the tree. D) Maximum likelihood tree of all RSV-B genomes (N=944; MA genomes in orange, WA genomes in yellow, others in gray). The tMCRCA for 2022 RSV-B genomes was approximately 2016 (ML CI: 2015–08, 2016–08). In the box are zoomed in plots of the clades containing MA and WA with lines corresponding to clades on the tree. Explosion plot of E) RSV-A and F) RSV-B lineages circulating in autumn 2022 with the inferred tMRCA (gray dots) and associated confidence intervals (shaded regions) for each lineage.

