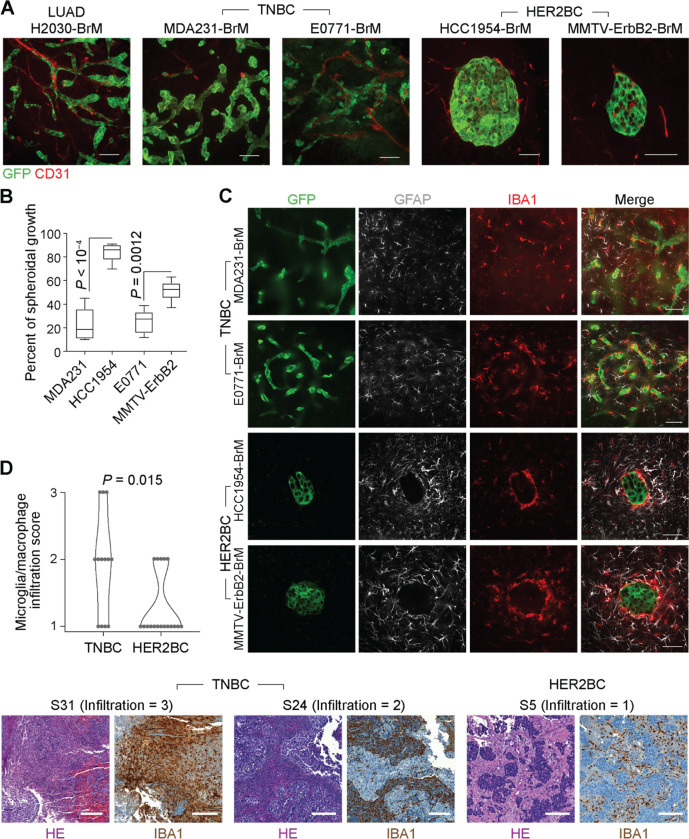
Figure 1. Perivascular and spheroidal brain colonization patterns and stromal interfaces.
(A) Representative immunofluorescence (IF) staining of vasculature (CD31+) and tumor lesions (GFP+) formed by brain metastatic derivatives (BrM) of the indicated cell lines. BrM cells were selected by inoculating primary cancer cells into the arterial circulation of mice (human cells into athymic mice, and mouse cells into syngeneic immunocompetent mice), and isolating the subpopulations that preferentially metastasize to the brain parenchyma11,94. Scale bars, 50 μm. (B) Percentage of spheroidal colonies in indicated TNBC and HER2BC brain metastasis models (n = 5–6 mice/group). (C) Infiltrative and segregated patterns of the TME in TNBC and HER2BC brain metastases, respectively. Representative IF staining showing the distribution of astrocytes (GFAP+) and microglia and macrophages (IBA1+) in indicated models. Scale bars, 50 μm. (D) (Top panel) Quantification and (bottom panel) representative H&E staining and immunohistochemistry (IHC) staining of IBA1 (microglia and macrophage infiltration) and associated infiltration scores in brain metastasis tissue samples derived from TNBC patients (n = 13) and HER2BC patients (n = 18). Scale bars, 200 μm.

