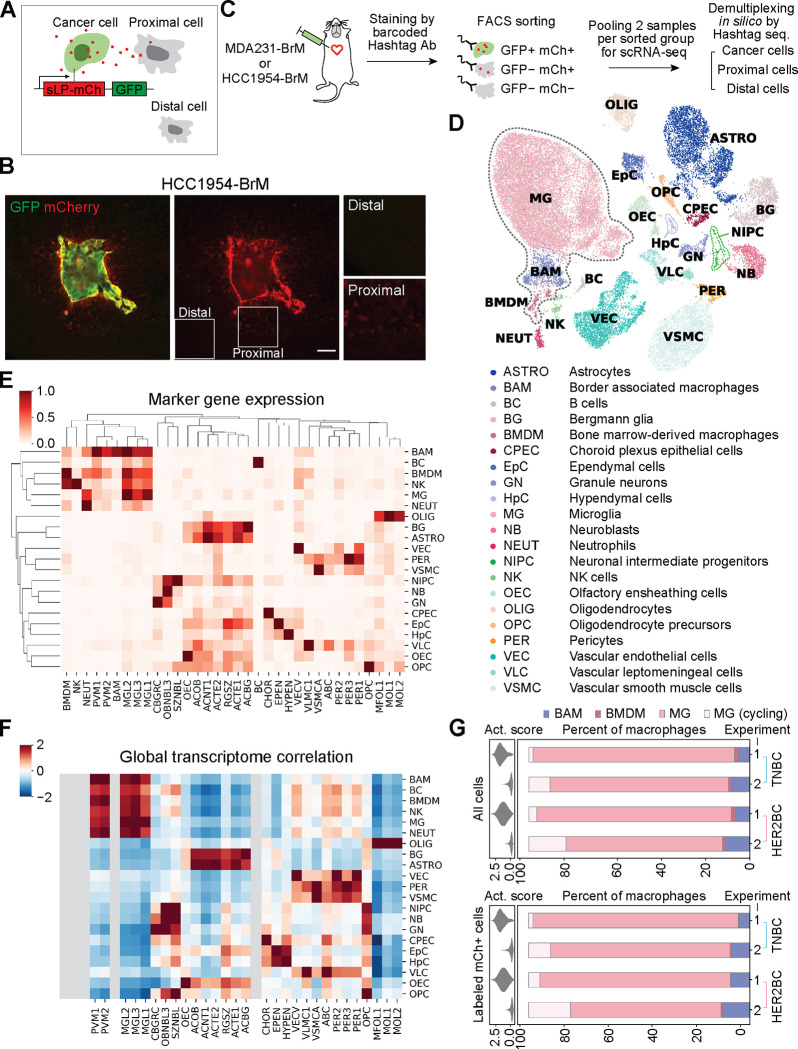
Figure 2. Cellular components of TME by metastatic niche labeling and scRNA-seq profiling.
(A) Schematic of the metastatic niche labeling system44. Cancer cells co-express GFP and a secreted, lipid-soluble sLP-mCherry protein that penetrates and labels adjacent cells as mCherry+. (B) Representative IF staining showing the labeling HCC1954-BrM HER2BC cells (GFP+, mCherry+), proximal labeled TME cells (mCherry+), and distal unlabeled cells (mCherry−). Scale bar, 50 μm. (C) Schematic of the workflow for profiling single-cell transcriptome of the indicated 3 FACS-sorted groups of cells from dissociated metastases-bearing mouse brains. MDA231-BrM TNBC and HCC1954-BrM HER2BC samples were processed in parallel with cell hashing95. Cells from each sample were stained with DNA-barcoded Hashtag antibodies (Ab) recognizing ubiquitous cell surface proteins. Distinct Hashtag sequences allowed pooling cells of two samples for each FACS-sorted group to be sequenced together, and then assigning sequenced cells to their samples of origin based on Hashtag sequences. See STAR Methods for details. (D-F) Calling the cell types of all non-cancer cells from scRNA-seq experiments 1 and 2. (D) UMAP plot of the identified cell populations from 31657 cells. All macrophages, including BAM, BMDM, and MG, are highlighted by dashed gray lines. (E) Clustering showing the population average for the marker genes of reference cell type and state clusters (columns) in each annotated cell population, denoted by the same abbreviated terms as used in (D) (rows, with each row standardized to between 0 and 1). (F) Heatmap of global expression correlation between annotated cell populations (rows) and the cell type and state clusters of reference single-cell transcriptome atlas of the mouse nervous system46 (columns, mousebrain.org), z-normalized per row. Rows and columns are organized in identical order with clustermap in (E) to assist visual inspection. Cell types (BMDM, NK, NEUT, BAM, BC) absent in the reference atlas are grayed out. (E, F) Consistent patterns between the marker gene detection (E) and global expression correlation in (F) support robust cell type annotation. See STAR Methods and Table S1 for details of cell type annotation. (G) Tissue dissociation-associated ex vivo activation scores (violin plot, left panels) and percentage of the indicated subsets of macrophages (bar plot, right panels) among all macrophages (labeled and unlabeled, top panels) or only labeled macrophages (bottom panels), collected in two independent experiments (1, 2) from the whole brain tissue bearing MDA231-BrM or HCC1954-BrM metastases. MG, microglia computationally identified to be in the G1 phase or not cycling. MG (cycling), microglia inferred to be cycling, given high scores of the S and G2/M phases. BAM, border associated macrophages. BMDM, bone marrow-derived macrophages. Activation scores were computed on the expression of genes that could be further upregulated ex vivo by enzymatic dissociation of the brain45 (listed in Table S2), and diminished by the addition of transcription and translation inhibitors during brain tissue harvesting and homogenizing in experiment 2.

