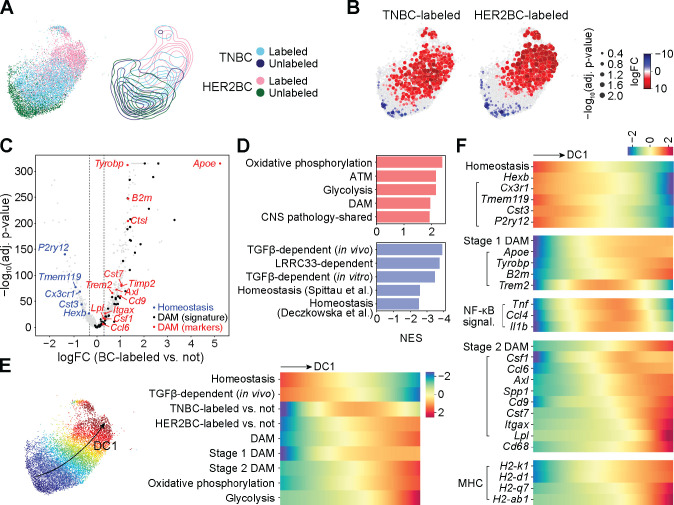
Figure 3. Tumor-associated microglia activate canonical DAM programs.
All results computed on the non-cycling microglia (MG) from experiment 1. See figure S4 for replication of homeostasis-to-DAM transition trends in experiment 2. (A) (Left panel) UMAP embedding of the 4 indicated sources of altogether 11407 cells, and (right panel) contour plots of each source in the embedding. (B) Differential abundance of TNBC-labeled (left panel) and HER2BC-labeled (right panel) cells in reference to unlabeled cells in all phenotypic neighborhoods, overlayed on the UMAP embedding of the index cells of phenotypic neighborhoods. Color and dot size represent the log fold change (logFC) and Benjamini-Hochberg (BH)-adjusted P values of differential abundance, respectively. UMAP embedding of all cells are shown in the background to facilitate visually locating the index cells. (C) Volcano plot of the logFC in gene expression against corresponding BH-adjusted P values, comparing between groups of phenotypic neighborhoods that are concordantly enriched in or depleted of breast cancer (BC) cell-labeled non-cycling microglia, which identified 838 differentially expressed genes (DEGs). logFC thresholds used for calling DEGs are indicated by dashed lines. Sources and lists of genes for DAM48 (signature) (black), and DAM (markers) (red) and homeostasis49 (blue) are provided in Table S2. (D) Normalized enrichment scores (NES) of the top 5 positively or negatively enriched gene sets among 838 differentially expressed genes (DEGs, Table S3) of labeled non-cycling microglia. See STAR Methods and Tables S2, S4, and S5 for gene set annotations and full GSEA results. (E) (Left panel) UMAP plot showing the first diffusion component (DC1) values computed on all cells by color map; and (right panel) heatmap showing fitted trends of indicated neighborhood-level signature scores and labeled cell enrichment (quantified by the local logFC in abundance in reference to unlabeled cells, logFC, shown in (B)) along the DC1 values of neighborhood index cells (shown in color, left panel) (rows, z-normalized per row across neighborhoods). Homeostasis, stage 1 DAM, and stage 2 DAM marker genes from Ref.49; and signatures of TGF-β-dependent expression (in vivo), DAM, oxidative phosphorylation, and glycolysis obtained as in (D) (see STAR Methods and Table S2 for details). (F) Similar to (E) heatmap showing fitted trends of neighborhood-level signature scores and gene expression along the DC1 values of neighborhood index cells (rows, z-normalized per row across neighborhoods). Marker genes used to compute the indicated signature scores on their top are indicated by left parentheses.

