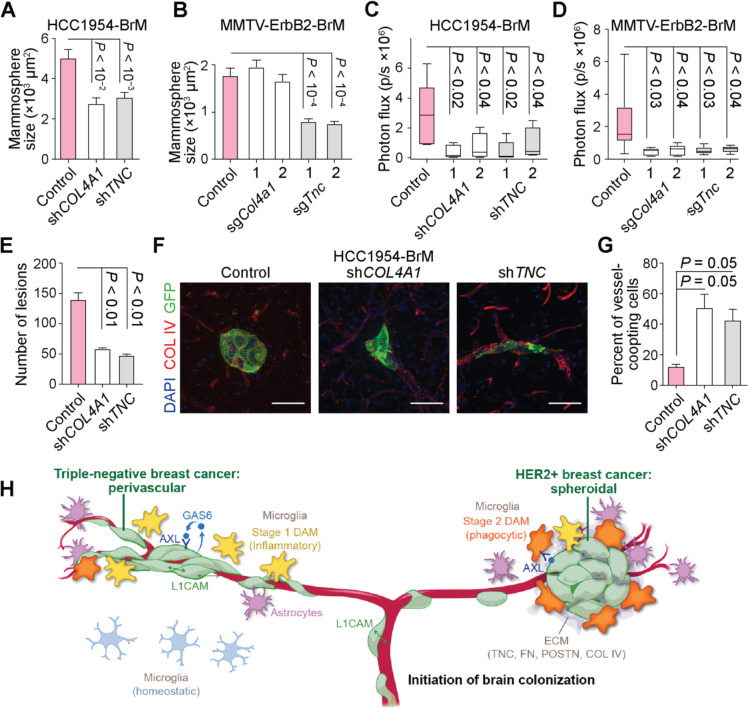
Figure 7. Impact of cancer cell-derived ECM on spheroidal HER2BC brain colonization.
(A-B) Effect of the suppression of COL4A1 and TNC expression on oncosphere formation (A) by shRNA in HCC1954-BrM cells and (B) by CRISPRi (2 sgRNAS per target gene) in MMTV-Erbb2-BrM cells, measured by the size of colonies after 5 days of growth in vitro. n = 100–175 colonies/group. Mean ± SEM. (C-D) Effect of the suppression of COL4A1 and TNC expression on brain colonization (C) by shRNA in HCC1954-BrM cells (n = 5 mice/group, 4 weeks after intracardiac inoculation into athymic mice, 2 shRNAs per target gene) and (D) by CRISPRi in MMTV-Erbb2-BrM cells (n = 5–9 mice/group, 3 weeks post-intracardiac inoculation into FVB/NJ mice, 2 sgRNAs per target gene), both quantified by whole-body BLI. (E-G) (E, G) Quantification and (F) representative IF staining of brain metastatic colonies formed by HCC1954-BrM cells expressing either a control vector or shRNAs that deplete COL4A1 or TNC expression. n = 3 mice/group. Mean ± SEM. Unpaired t test. (G) The percent of vascular coopting cells and (E) the number of colonies were determined 1 and 3 weeks post-intracardiac inoculation, respectively. (H) Schematic illustrates distinctive modes of colonization and stromal interface, various cancer cell-intrinsic mediators of colonization, and the induction of distinct DAM responses during the initiation of brain colonization in TNBC and HER2BC. Copyright © 2023 Memorial Sloan Kettering.

