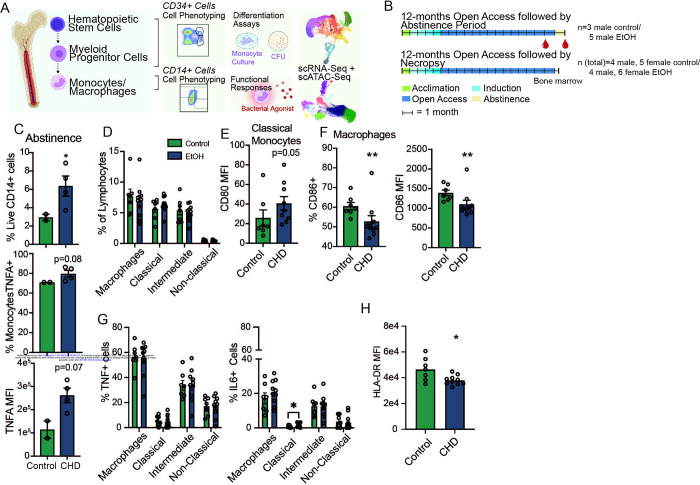
Figure 1: Inflammatory blood monocyte phenotype with CHD extends through abstinence.
A) Experimental design for study partially created on Biorender.com. B) CHD timeline (+/− abstinence) and blood/bone marrow collection for macaque cohorts. C) Flow cytometry phenotyping and intracellular cytokine staining (ICS) after 16-hour LPS stimulation were performed on total PBMC after 1-month abstinence. Bar plots showing % live CD14+ (top), % TNFα + monocytes (middle), and TNFα MFI from monocytes. ICS measurements were corrected for the unstimulated condition. D) Percentages of classical, intermediate, and non-classical monocytes, and CD169+ macrophages from live cells. E) Bar plot of CD80 MFI on classical monocytes. F) Bar plots of the percentage of CD86+ (left) and CD86 MFI (right) on macrophages. G) Total bone marrow cells were stimulated with a bacterial TLR cocktail (Pam3CSK4, LPS, and FSL-1) and the percentage of TNFα+ (left) and IL-6+ (right) were measured in each monocyte and macrophage population and corrected for the unstimulated condition. H) HLA-DR MFI was measured in macrophages after bacterial agonist stimulation by flow cytometry and corrected for the unstimulated condition. Statistical significance was tested by t-test with Welch’s correction where *=p<0.05, **=p<0.01.

