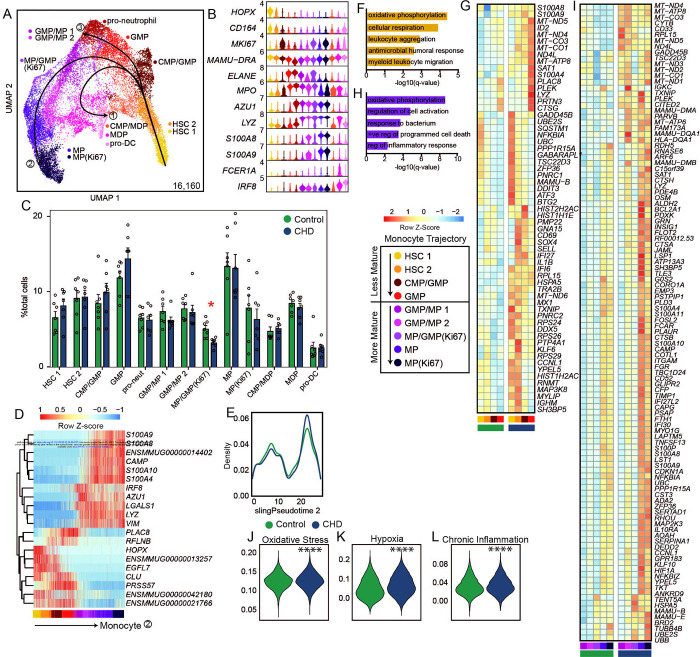
Figure 4: CHD CD34+ bone marrow myeloid progenitor single cell transcriptional profiles.
A) Myeloid lineage UMAP (16,160 cells) with Slingshot lineage projection lines. B) Stacked violin plot of marker gene expression. C) Cluster percentages between CHD and control groups. Compared by two-way ANOVA with multiple comparisons. D) Heatmap of genes explaining the monocyte lineage trajectory. E) Cell density plot for Control and CHD groups across the monocyte trajectory lineage determined by Slingshot. F,H) Functional enrichment terms from less (F) and more (H) mature clusters. G,I) Averaged gene expression of upregulated DEG from less (G) and more (I) mature clusters split by CHD and control groups. J-L) Violin plots for indicated module scores across groups. Statistical analysis was performed by Mann-Whitney. Unless indicated, statistical significance was tested by t-test with Welch’s correction. *=p<0.05, ****=p<0.0001.

