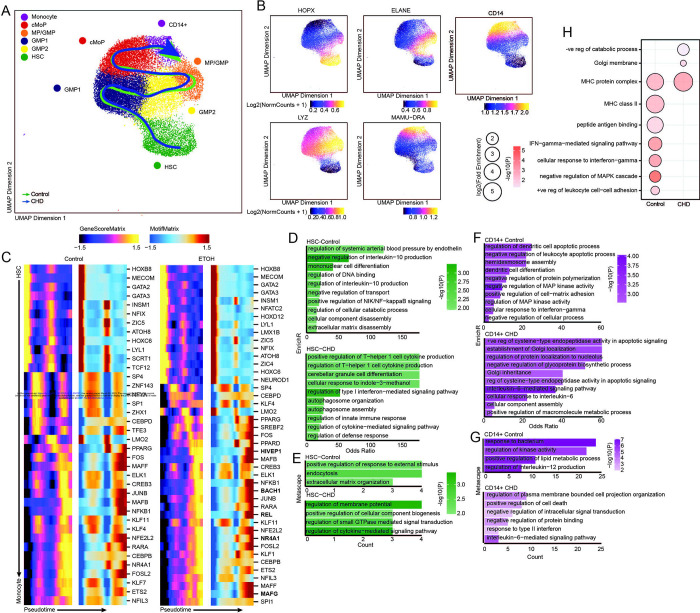
Figure 5: CD14+ and CD34+ bone marrow cell scATAC-Seq.
A) UMAP projection of myeloid lineage cells based on gene accessibility with pseudotime lineage lines for control and CHD groups. B) Feature plots of marker genes from the gene score matrix. C) Integrative analysis of TF gene scores and motif accessibility across the monocyte lineage pseudotime in control and CHD cells. Genes listed on CHD heatmap are observed only with CHD. D-G) Functional enrichment from EnrichR (D,F) and Metascape (E,G) databases for differentially accessible regions more open in the indicated group for HSC (D-E) and pro-monocyte (F-G) clusters. Color indicates the −log10(P) value and length indicates the Odds Ratio from EnrichR (D,F) or the number of genes mapping to the term from metascape (E,G). (H) Functional enrichment determined by GO Biological Process within GREAT database for differentially accessible regions more open control (left) and CHD (right) groups for the pro-monocyte cluster. Color indicates the −log10(P) value and length indicates the log2(Fold Enrichment).

