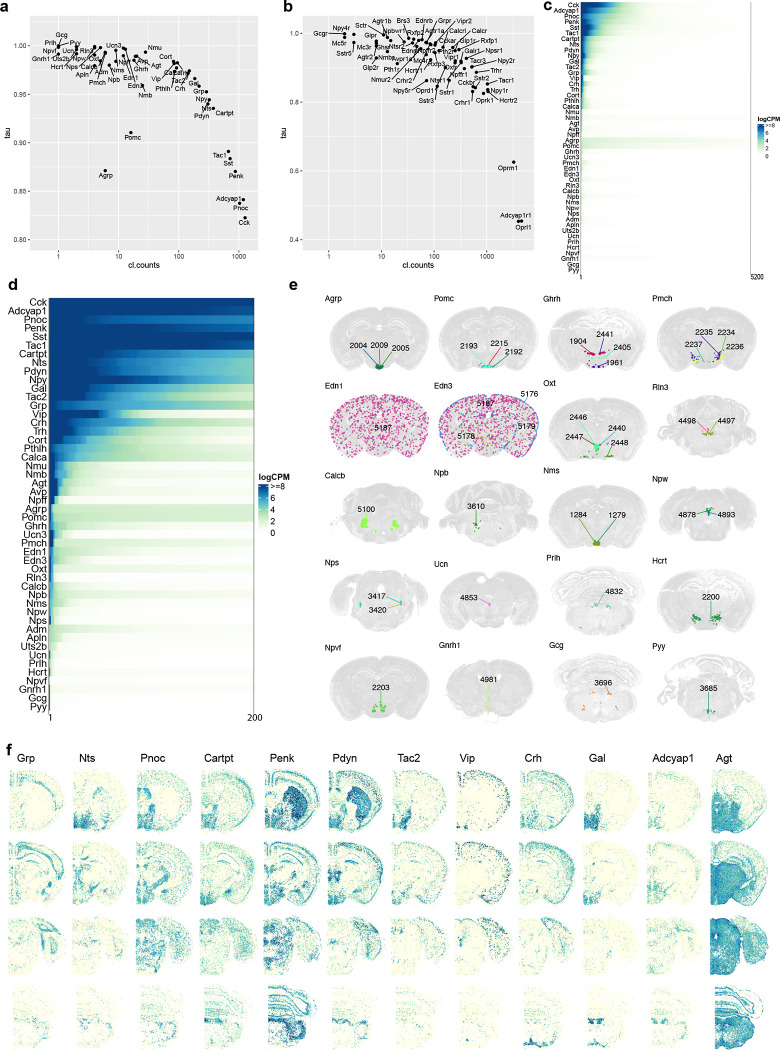
Extended Data Figure 7. Neuropeptide distribution across the whole mouse brain.
(a) Scatter plot of Tau score over the number of clusters each neuropeptide is expressed in at the level of logCPM > 3. The Tau score is a measurement of cell type specificity, which varies from 0 to 1 where 0 means uniformly expressed and 1 means highly specific to one type. (b) Scatter plot of Tau score over the number of clusters each peptide-liganded G-protein coupled receptor (GPCR) gene is expressed in at the level of logCPM > 3. (c) Expression level of neuropeptide (logCPM) per cluster. For each neuropeptide along the Y axis, clusters are sorted from the highest to lowest mean gene expression level along the X axis. (d) Expression level of neuropeptide (logCPM) per cluster. For each neuropeptide along the Y axis, clusters are sorted from the highest to lowest mean gene expression level along the X axis. For each gene, only the top 200 highest-expressing clusters out of 5,200 clusters are shown. (e) Representative MERFISH sections highlighting the spatial location of clusters expressing each of the 20 highly cell-type-specific neuropeptide genes (expressed in 8 or fewer clusters). (f) Representative MERFISH sections showing the expression of the neuropeptides present on the MERFISH gene panel that are widely expressed.

