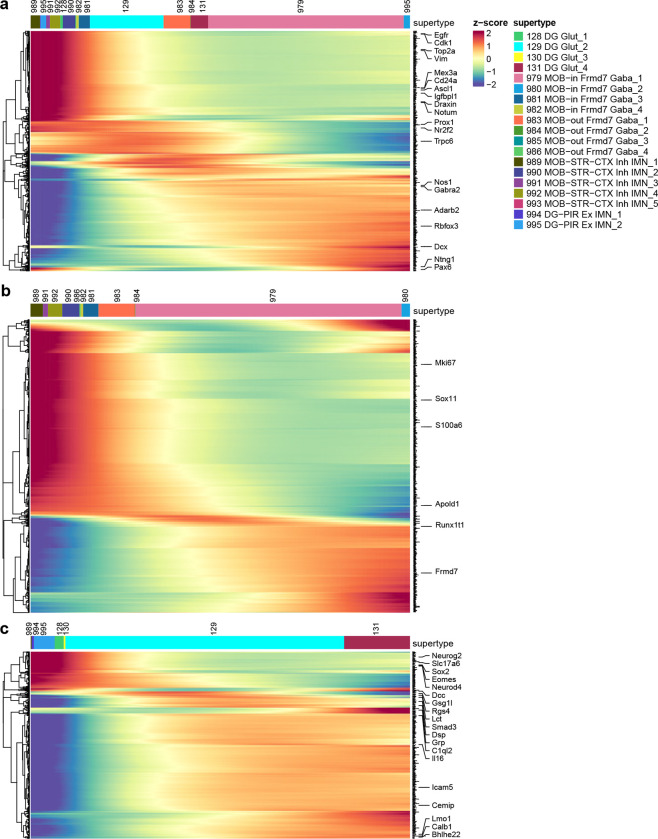
Extended Data Figure 9. Gene expression patterns in immature neuron populations.
(a) Heatmap showing the gene expression changes as immature neurons transition to mature cell types, conserved between DG and MOB cell type development. Key markers at each stage of development are highlighted. (b) Heatmap showing the gene expression changes as immature neurons transition to mature cell types, specific to MOB cell types. (c) Heatmap showing the gene expression changes as immature neurons transition to mature cell types, specific to DG cell types.

