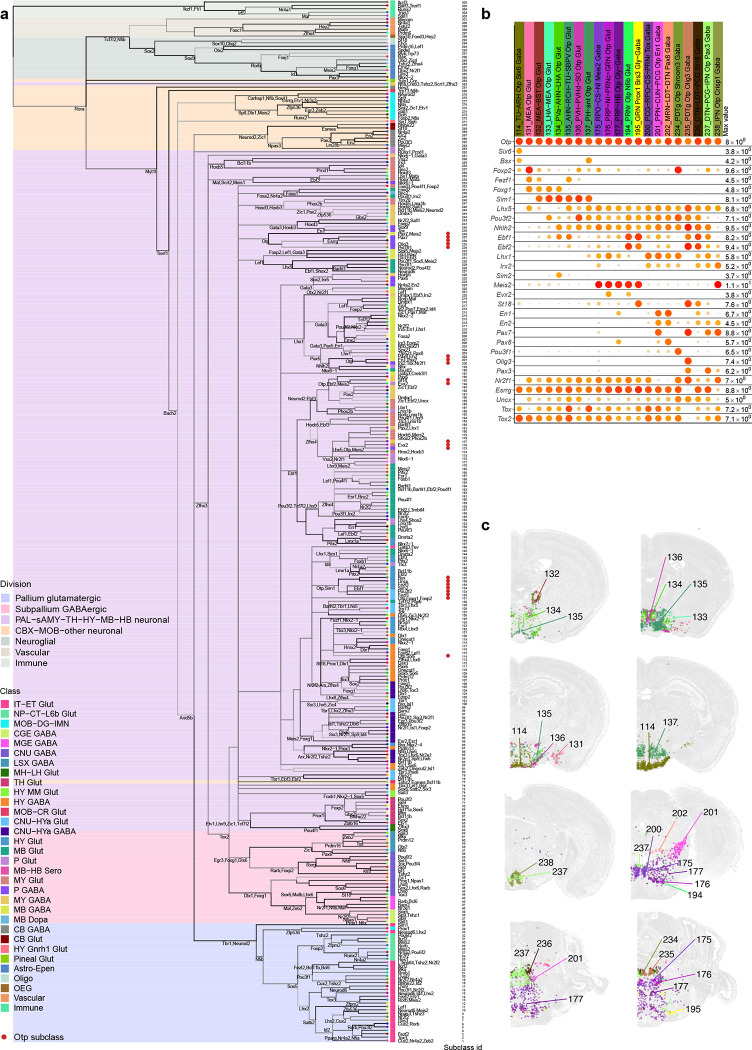
Extended Data Figure 10. Transcription factor code.
(a) The transcriptomic taxonomy tree of 306 subclasses organized in a dendrogram (same as Figure 1a). The color blocks divide the dendrogram into major cell divisions. The color bars denote classes. Key transcription factors are annotated for nodes and subclasses on the tree. Red dots mark the Otp expressing subclasses described in panels (b) and (c). (b) Gene expression dot plot of Otp expressing subclasses. Dot size and color indicate proportion of expressing cells and average expression level in each subclass, respectively. (c) Representative MERFISH sections highlighting the Otp expressing subclasses.

