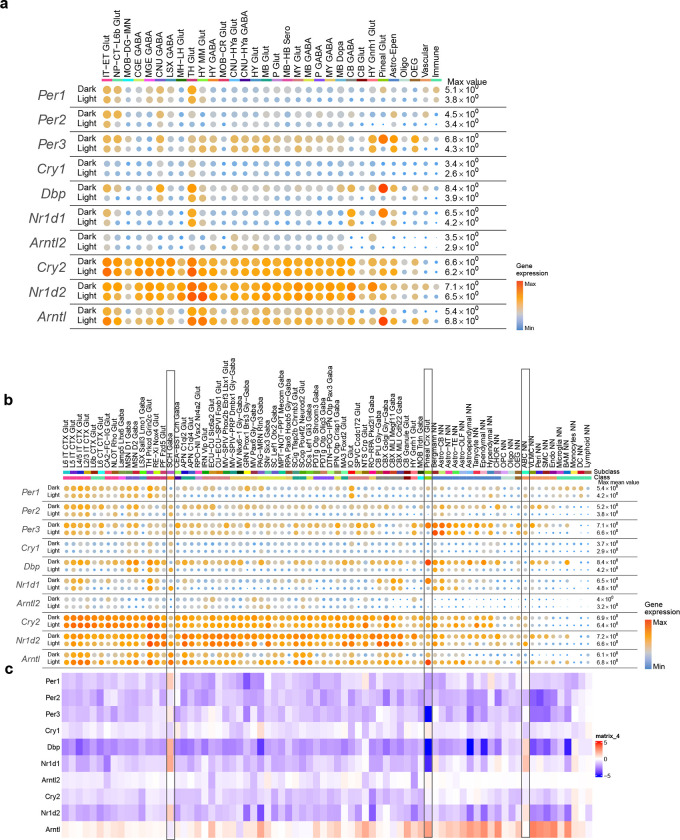
Extended Data Figure 12. Circadian cycle associated expression changes in clock genes.
(a-b) Dot plot showing the expression of clock genes in light-phase and dark-phase cells within each cell class (a) or selected subclasses that have any clock genes with fold change logFC > 1 between light and dark phases (b). Dot size and color indicate proportion of expressing cells and average expression level in each class or subclass, respectively. (c) Heatmap showing the logFC difference between light and dark phases for clock genes in selected subclasses as in (b).

