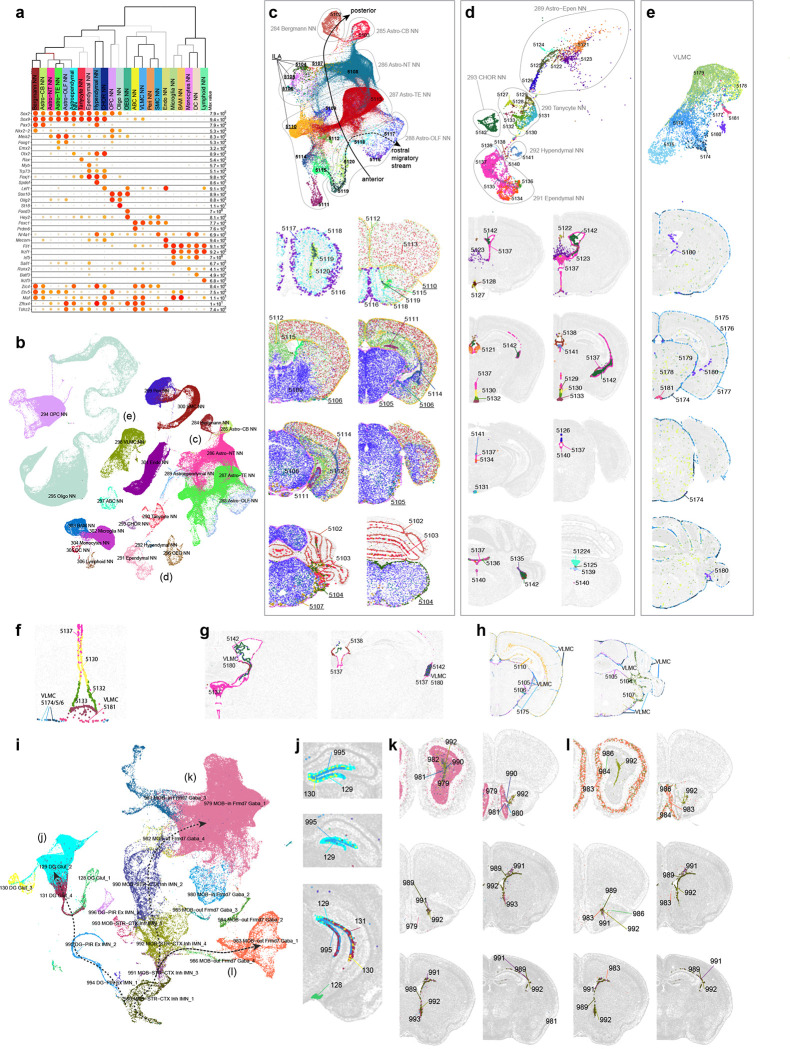
Figure 4. Non-neuronal cell types and immature neuronal types.
(a) Dot plot showing the transcription factor marker gene expression in non-neuronal subclasses. Dot size and color indicate proportion of expressing cells and average expression level in each subclass, respectively. (b) UMAP representation of non-neuronal cell types colored by subclass. Three subpopulations are highlighted and further investigated: astrocytes (c), ependymal cells (d), and VLMC (e). (c-e) UMAP representation and representative MERFISH sections of astrocytes (c), ependymal cells (d), and VLMC (e) colored and numbered by cluster. Outlines in (c-d) UMAPs show subclasses. (f) Co-localization of VLMC cluster 5181 with Tanycyte cluster 5133 on the MERFISH section. (g) Co-localization of VLMC cluster 5180 with CHOR cluster 5142 and Ependymal clusters 5137 and 5138. (h) Co-localization of VLMCs with Interlaminar astrocytes (ILA). (i) UMAP representation of immature neuron populations colored by supertype. Maturation trajectories in dentate gyrus (DG) (j), inner main olfactory bulb (k), and outer main olfactory bulb (l) are highlighted. (j-l) Representative MERFISH sections showing location of immature neuronal supertypes from the three trajectories.

