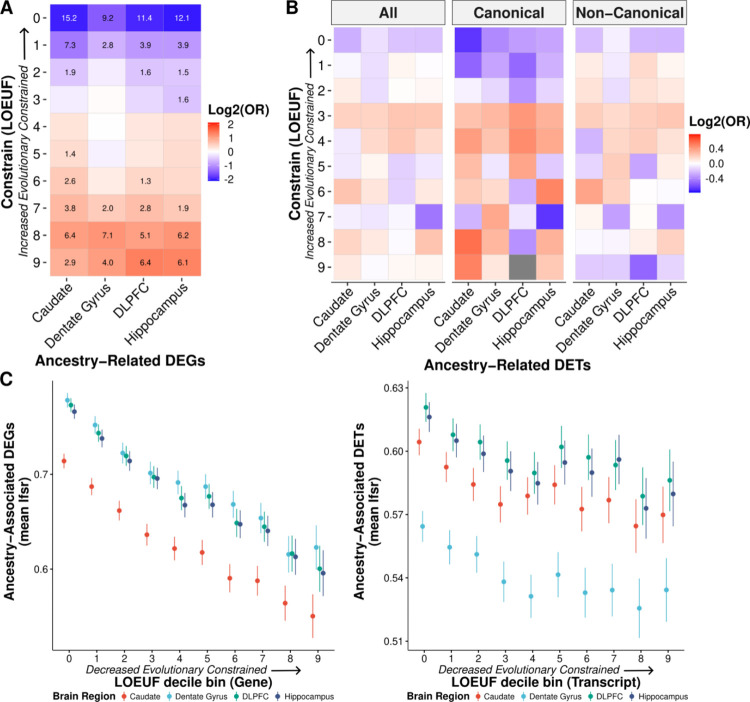
Fig. 3: Ancestry-associated genes and canonical transcripts are evolutionarily less constrained.
A. Significant depletion of ancestry DEGs for evolutionarily constrained genes (canonical transcripts) across brain regions. Significant depletion/enrichments (two-sided, Fisher’s exact test, FDR corrected p-values, −log10 transformed) are annotated within tiles. Odds ratios (OR) are log2 transformed to highlight depletion (blue) and enrichment (red). B. Similar trend of depletion of ancestry DE transcripts (DETs; all, canonical, and non-canonical) for evolutionarily constrained transcripts across brain regions. Odds ratios are log2 transformed to highlight depletion (blue) and enrichment (red). C. The mean of ancestry-associated DE feature (i.e., gene and transcript) lfsr as a function of LOEUF (loss-of-function observed/expected upper bound fraction) decile shows a significant negative correlation for genes (left; for the caudate, dentate gyrus, DLPFC, and hippocampus: two-sided, Pearson, r = −0.20, −0.20, −0.21, and −0.21; p-value = 3.0×10−122, 7.6 × 10−113, 8.6×10−126, and 1.2 × 10−122) and transcripts (right; for the caudate, dentate gyrus, DLPFC, and hippocampus: two-sided, Pearson, r = −0.05, −0.05, −0.04, and −0.04; p-value = 8.6×10⁻¹³, 1.7× 10⁻¹¹, 9.0×10⁻¹¹, and 3.2 × 10⁻¹⁰). Error bars correspond to 95% confidence intervals.

