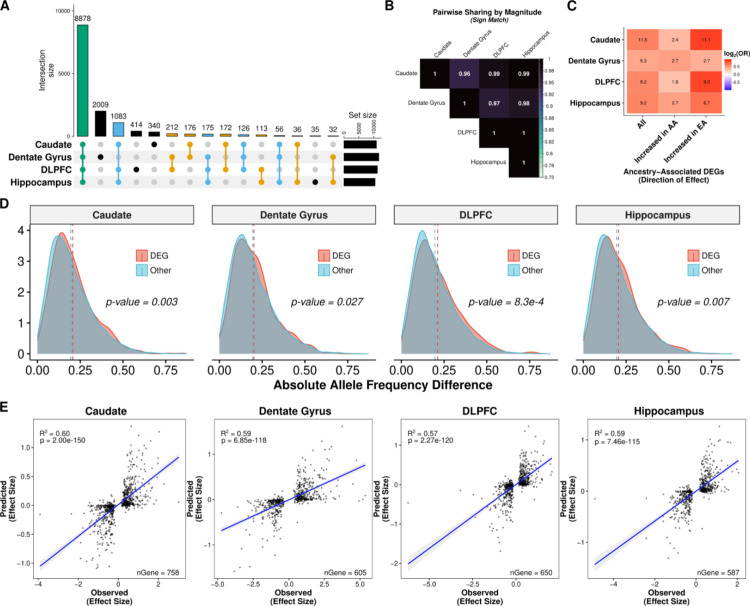
Fig. 4: Genetic contribution of genetic ancestry differences in expression across the brain.
A. UpSet plot showing large overlap between brain regions of eGenes. B. Heatmap of the proportion of ancestry DEG sharing with concordant direction (sign match). C. Significant enrichment of ancestry-associated DE genes for eGenes (unique gene associated with an eQTL) across brain regions separated by direction of effect (increased in AA or EA proportion). D. Density plot showing significant increase in absolute allele frequency differences (AFD; one-sided, Mann-Whitney U, p-value < 0.05) for global ancestry-associated DEGs (red) compared with non-DEGs (blue) across brain regions. A dashed line marks the mean absolute AFD. Absolute AFD calculated as the average absolute AFD across a gene using significant eQTL (lfsr < 0.05). E. Correlation (two-sided, Spearman) of elastic net predicted (y-axis) versus observed (x-axis) ancestry-associated differences in expression among ancestry-associated DEGs with an eQTL across brain regions. A fitted trend line is presented in blue as the mean values +/− standard deviation. The standard deviation is shaded in light gray.

