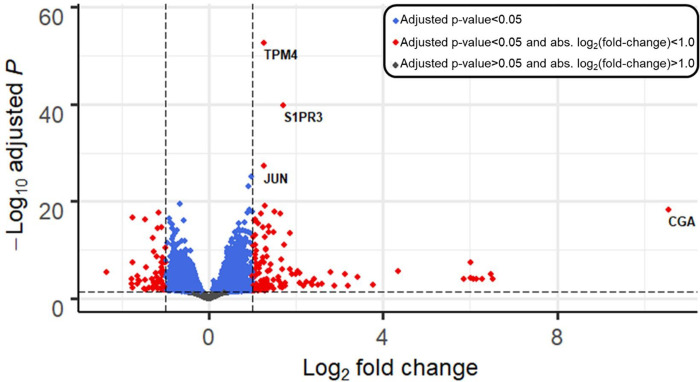
Figure 2. Volcano plot depicting differential gene expression in K562 cells after 24-h treatment with BeWo-conditioned medium vs. compared to unconditioned medium (control).
Genes are plotted by log2(fold change) (x-axis), and −log10(adjusted p-values) (y-axis). Horizontal line shows significance cutoff (adjusted p-value<0.05). Vertical lines show fold-change cutoffs of absolute log2(fold-change) > 1. Blue points have adjusted p-values < 0.05. Red points adjusted p-values < 0.05 plus log-fold change > 1.0.

