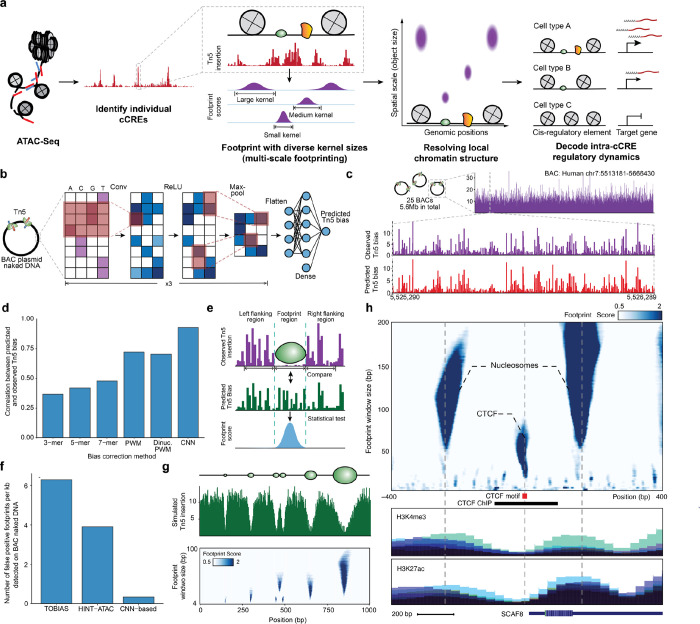
Figure 1. Multi-scale footprinting detects DNA-protein interactions at various spatial scales.
a, Overview of the multi-scale footprinting workflow. b, Schematic illustration of the Tn5 bias prediction model. c, Single-nucleotide resolution tracks of observed and predicted Tn5 bias on naked DNA in the BAC RP11–93G19. d, Bar plot comparing performance of the CNN model with previous bias correction models. e, Schematic illustration of footprint score calculation. f, Bar plot showing the frequency of calling false positive footprints by previous ATAC-footprinting methods and our method. g, Multi-scale footprints with simulated objects. Top: schematic of simulated objects with various sizes. Middle: Simulated single base pair resolution Tn5 insertion tracks based on the above objects. Bottom: Heatmap showing the multi-scale footprints calculated based on the simulated Tn5 insertions. The horizontal axis represents single base pair positions, and the vertical axis represents footprint window sizes. h, Multi-scale footprints in the cCRE region chr6:154732871–154733870. Bottom tracks are histone ChIP signals obtained from ENCODE.

