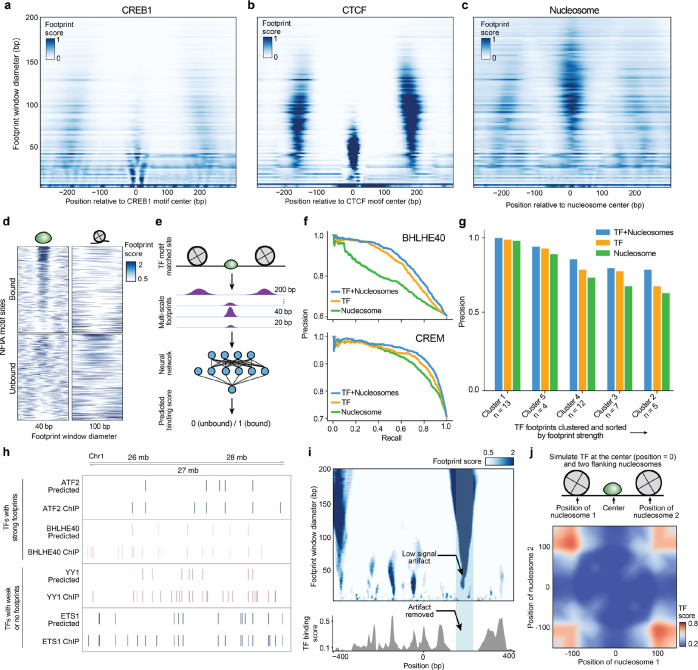
Figure 2. TFs and nucleosomes binding leave signature multi-scale footprint patterns.
a, b, Multi-scale aggregate footprints for TFs CREB1 and CTCF. The x-axis represents the position relative to the center of the TF motif, and the y-axis represents footprint scores computed using each footprint window size. c, Multi-scale aggregate footprints for nucleosomes. The x-axis represents the position relative to the center of the nucleosome as determined by chemical mapping, and the y-axis represents footprint scores computed using each footprint window size. d, Multi-scale footprints around individual bound and unbound NFIA motif sites. Each row represents a single locus with a matched NFIA motif. e, Schematic illustration of training TF binding prediction models using multi-scale footprints as input. f-g Ablation test results. f, Example precision-recall curves of cluster 1-specific models trained without masking, with TF masking, and with nucleosome masking, respectively. g, Bar plot showing precision of the TF habitation model when trained without masking, with TF masking, and with nucleosome masking, respectively. h, Comparison between predicted and ChIP-detected TF binding sites. Only sites with a matched TF motif are included. i, Top: heatmap showing multi-scale footprints within the cCRE at chr11:67629937–67630936. The x-axis represents single base pair positions in the cCRE, and the y-axis represents footprint window size. Bottom: predicted TF binding scores within the same region. j, Heatmap showing predicted TF habitation score for different simulated TF and nucleosome configurations. Horizontal and vertical axes represent the distances of the two simulated nucleosomes from the center TF.

