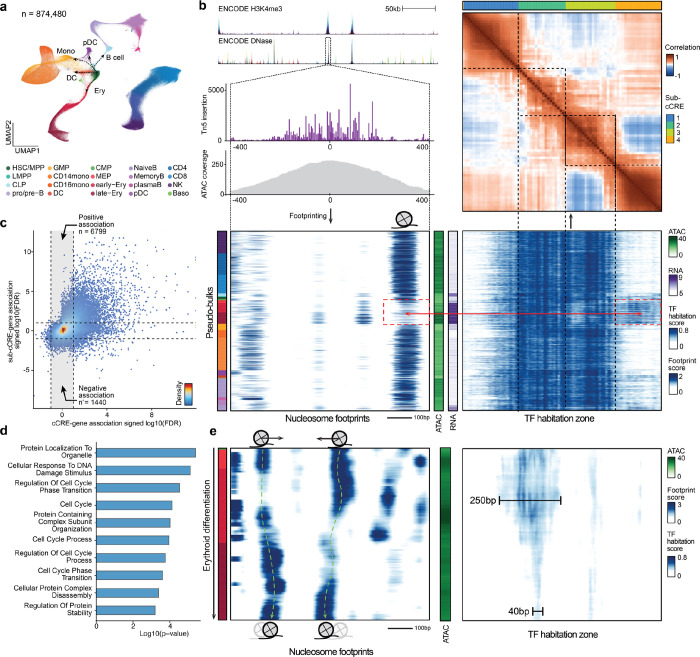
Figure 3. Emerging modular structures of intra-cCRE dynamics.
a, UMAP of the human bone marrow SHARE-seq dataset. b, Example of sub-cCREs. Top left: Tracks showing chromatin accessibility and single-base pair resolution Tn5 insertion in the cCRE at chr4:173334022–173335021. Bottom left and bottom right: Heatmap of nucleosome footprints (100 bp scale) and TF habitation scores in the same region across all pseudo-bulks, respectively. Each row corresponds to a single pseudo-bulk, while each column represents a single base pair position in the cCRE. Left color bar shows the cell type annotation of each pseudo-bulk. Color palette is the same as in a. Middle color bars show total accessibility within the cCRE and RNA level of the gene HMGB2 in each pseudo-bulk, respectively. Top right: Heatmap showing correlation of TF habitation scores between any two positions within the cCRE. Top color bar shows results of automatic segmentation of the cCRE into sub-cCREs. c, Scatter plot comparing cCRE-gene correlation and sub-cCRE-gene correlation. For each cCRE, the sub-cCRE with the strongest correlation is selected. Dashed lines represent the FDR threshold of 0.1. d, Bar plot showing pathway enrichment of genes with significant sub-cCRE-gene correlation but not cCRE-gene correlation (FDR < 0.1). e, Nucleosome tracking across erythroid differentiation. Left: Heatmap of nucleosome footprints in the region chr7:99471434–99472433 across pseudo-bulks in the erythroid lineage. Pseudo-bulks are ordered by pseudo-time. Right: heatmap of TF habitation scores in the same region and pseudo-bulks. Left color bar shows the cell type annotation of each pseudo-bulk. Color palette is the same as in a. Middle color bar shows total accessibility within the cCRE in each pseudo-bulk.

