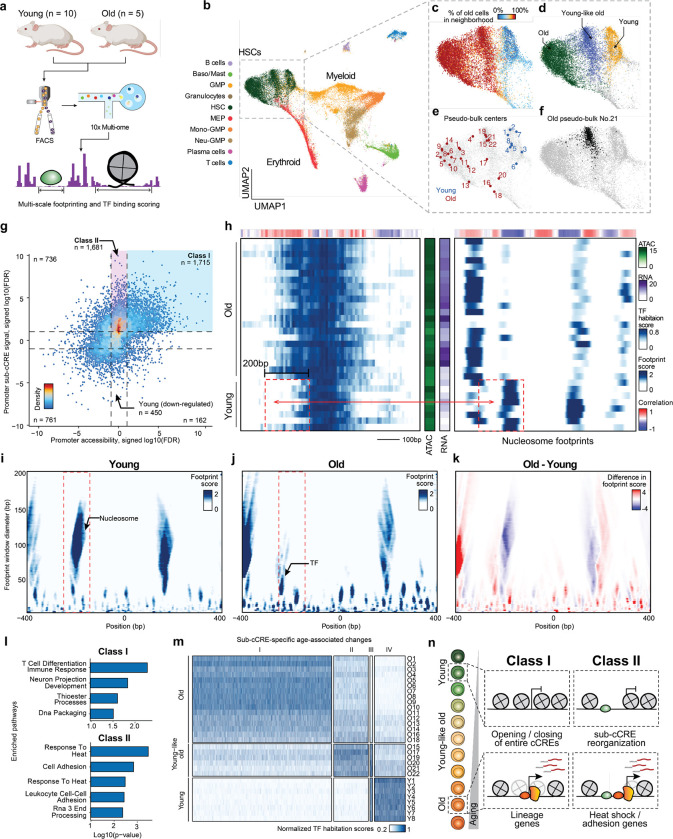
Figure 4. Intra-cCRE dynamics in hematopoietic aging.
a, Schematic illustration of dataset generation and analysis. b-f, UMAP of HSC and progenitor cells. b, Cell type annotation. c, Percentage of old cells in the 100-cell nearest neighborhood. d, Young, young-like old, and old HSC clusters. e, Representative cell states detected by SEACells. f, Example pseudo-bulk. Black dots represent member cells in old pseudo-bulk 21. g, Scatter plot comparing differential cCRE testing and differential sub-cCRE testing results for promoters of differentially expressed genes. Dashed lines represent the FDR = 0.1 threshold. h, Heatmaps of TF habitation scores and nucleosome footprints (100 bp scale) within the promoter of Cdc25b at chr2:131186436-131187435. Each row corresponds to a single pseudo-bulk, while each column represents a single base pair position in the cCRE. Middle color bars show total accessibility within the cCRE and RNA of Cdc25b in each pseudo-bulk, respectively. i-k, Heatmaps showing the multi-scale footprints within the Cdc25b promoter across age groups. The horizontal axis represents single base pair positions, and the vertical axis represents footprint window sizes. i, Young. j, Old. k, difference between young and old. l, Bar plot of pathway enrichment Amy using either Class I or Class II as foreground and the other category as background. m, Heatmap showing activity of age-related differential sub-cCREs across pseudo-bulks. Rows correspond to pseudo-bulks and columns represent sub-cCREs. n, Schematic illustrating contrasting two classes of age-related cCRE changes (modulation of overall cCRE accessibility and intra-cCRE reorganization).

