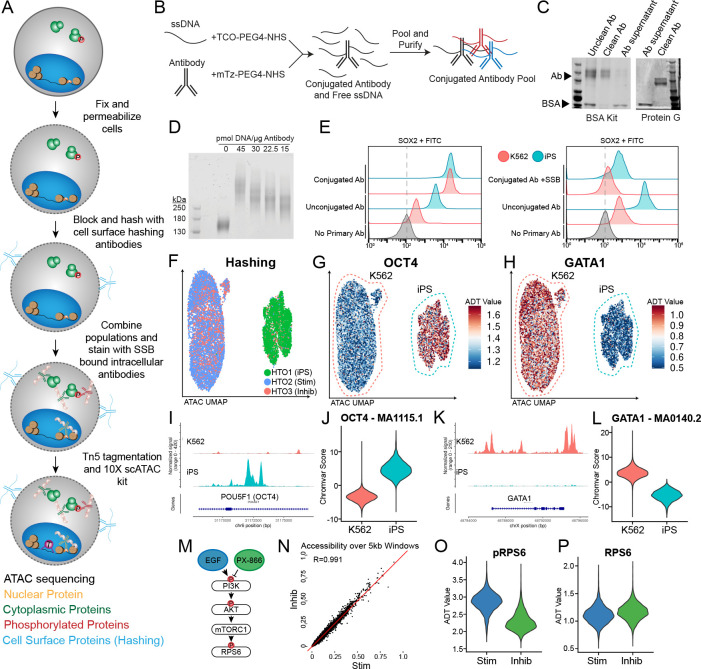
Figure 1: Phospho-seq procedure and pilot experiment.
a) Schematic of Phospho-seq workflow. b) Schematic of antibody conjugation procedure. c) Protein gel results of two antibody purification methods using the Abcam BSA Removal Kit (left panel) and Promega Magne Protein G beads (right panel). d) Protein gel of mTz-PEG4-NHS labeled antibodies incubated with different quantities of TCO-PEG4-NHS labeled ssDNA tags. e) Flow cytometry plots of K562 and iPS cells stained with unconjugated and conjugated SOX2 antibodies (left panel) and unconjugated and conjugated + single-stranded DNA binding protein SOX2 antibodies (right panel) with unstained controls. f) UMAP representation from scATAC-Seq of K562 and iPS cells colored by demultiplexed HTOs assigned to each cell. g) UMAP representation of K562 and iPS cells colored by normalized ADT values for OCT4. h) UMAP representation of K562 and iPS cells colored by normalized ADT values for GATA1. i) Coverage plot of chromatin accessibility of K562 and iPS cells at the POU5F1 (OCT4) genomic locus. j) Violin plot of chromVAR scores for the OCT4 TF binding motif (MA1115.1) in K562 and iPS cells. k) Coverage plot of chromatin accessibility of K562 and iPS cells at the GATA1 genomic locus. l) Violin plot of chromVAR scores for the GATA1 TF binding motif (MA0140.2) in K562 and iPS cells m) Schematic of PI3K/AKT/mTORC1 pathway activation and repression paradigm used in this experiment. n) Scatter plot of pseudobulked chromatin accessibility data in 5 kb windows across the genome comparing inhibited K562 cells with stimulated K562 cells. Red line indicates perfect correlation between the two conditions. o) Violin plot of normalized pRPS6 values in stimulated (Stim) and inhibited (Inhib) K562 cells. p) Violin plot of normalized RPS6 values in stimulated (Stim) and inhibited (Inhib) K562 cells.

