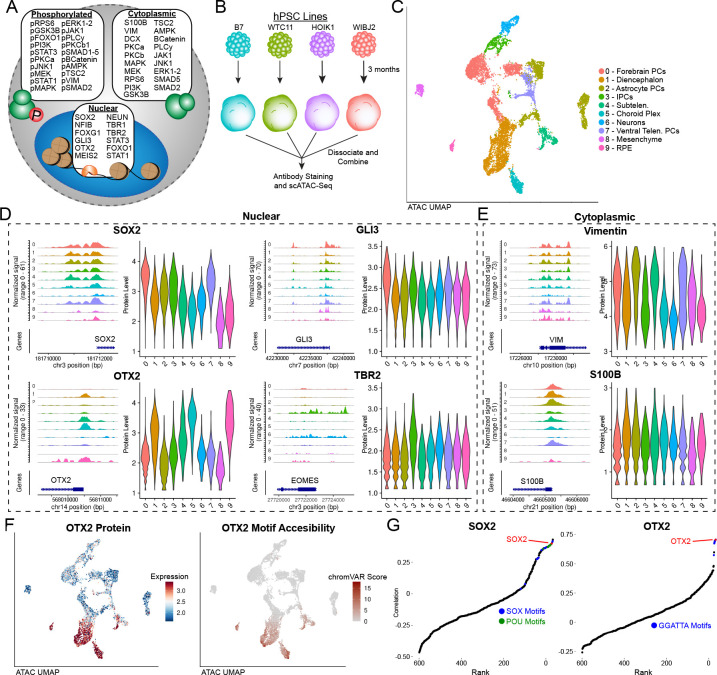
Figure 2: Phospho-seq on brain organoids.
a) Schematic of antibody panel used in brain organoid Phospho-seq experiment and the cellular compartment of the target protein. b) Schematic of brain organoid differentiation. c) UMAP representation of cells and cell type assignments based on the ATAC-seq modality in Phospho-seq. d) Coverage and violin plots of the gene promoters and protein levels respectively of four nuclear proteins included in the Phospho-seq panel (SOX2,GLI3,OTX2 and TBR2), color and order are same as in (c). e) Coverage and violin plots of the gene promoters and protein levels respectively of two cytoplasmic proteins included in the Phospho-seq panel (Vimentin and S100B), color and order are same as in (c). f) UMAP representation of cells colored by normalized ADT values for OTX2 (left panel), UMAP representation of cells colored by chromVAR scores for OTX2 motif accessibility. g) Rank-correlation plots for transcription factor motifs vs. SOX2 (left panel) and OTX2 (right panel) with the TF motif of interest indicated in red.

