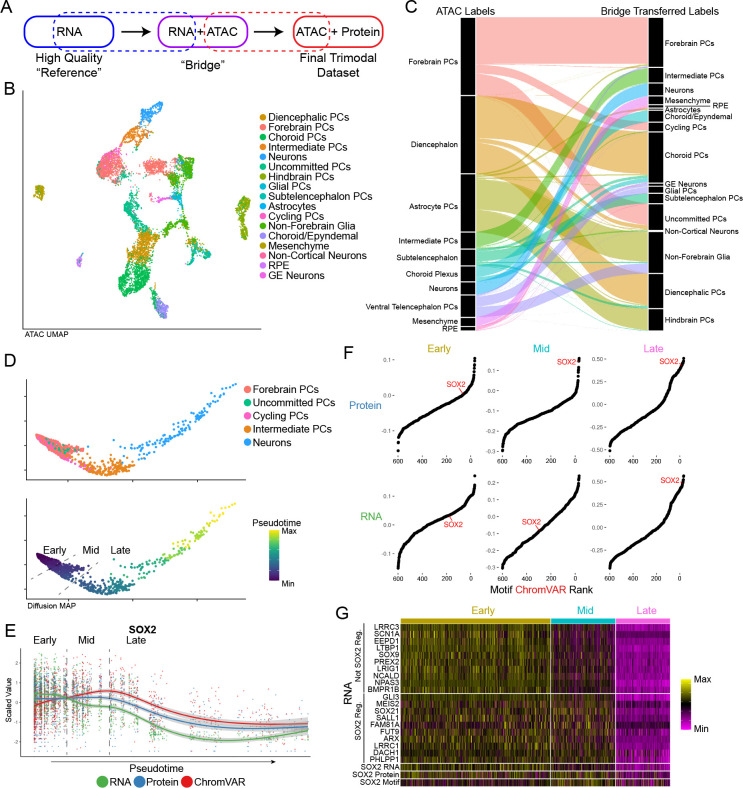
Figure 3: Bridge integration.
a) Schematic of bridge integration. b) UMAP representation of cells based on ATAC-seq modality with cell type assignments from bridge integration. c) Alluvial plot demonstrating cell label transfer when using bridge integration. d) Diffusion map of cells differentiating from Forebrain PCs to Neurons colored by cell type (top panel) and pseudotime as determined by monocle (bottom panel). Dashed lines indicate pseudotime cut-offs determined by SOX2 expression and activity. e) Scatter plot showing scaled values of SOX2 RNA, protein and motif chromVAR score across pseudotime as determined in (d). Dashed lines indicate the same SOX2-based pseudotime cut-offs as in (d). f) Rank-correlation plots of the correlation of transcription factor motif accessibility vs. SOX2 Protein (top panel) and SOX2 RNA (bottom panel) for each of the pseudotime cut-off group. g) Heatmap of a subset of genes not regulated by SOX2 and regulated by SOX2 across pseudotime bins.

