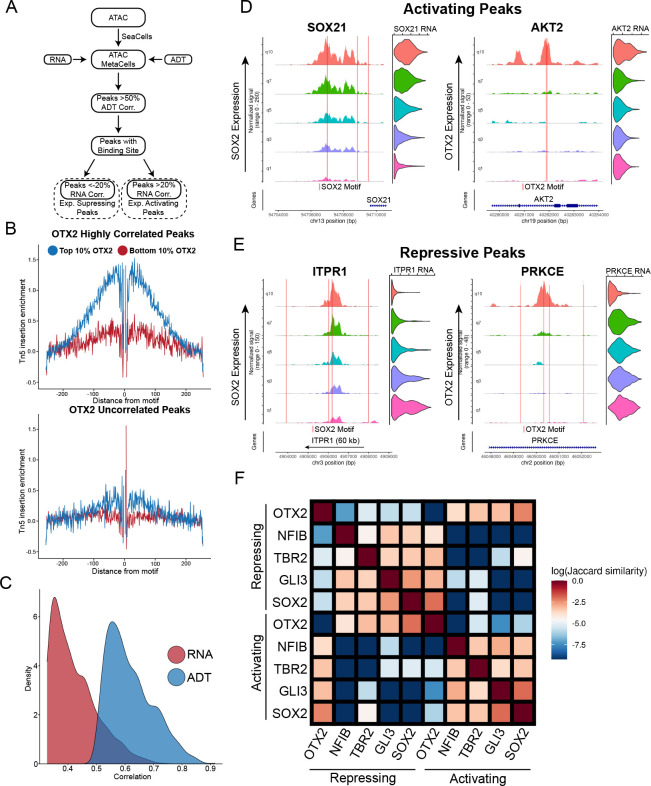
Figure 4: Transcription factor-specific cis-regulatory element discovery.
a) Schematic of approach to use metacelling to discover cis-regulatory elements associated with individual proteins. b) Tn5 cut-site footprinting between cells with high OTX2 expression and low OTX2 expression in peaks that are highly correlated with OTX2 (top panel) and uncorrelated with OTX2 (bottom panel). c) Density of the correlations of top 1000 SOX2 correlated peaks when using SOX2 RNA from the multiome vs. SOX2 ADT. d) Examples of inferred transcription activating peaks associated with indicated proximal gene expression for SOX2 (left panel) and OTX2 (right panel). Coverage plots and violin plots are ordered by quantile ADT expression for each protein. Red lines indicated the location of a binding motif for each respective protein. e) Examples of inferred transcription repressing peaks associated with indicated proximal gene expression for SOX2 (left panel) and OTX2 (right panel). Coverage plots and violin plots are ordered by quantile ADT expression for each protein. f) Jaccard similarity matrix of inferred activating and repressing peaks from each of the TFs highlighted

