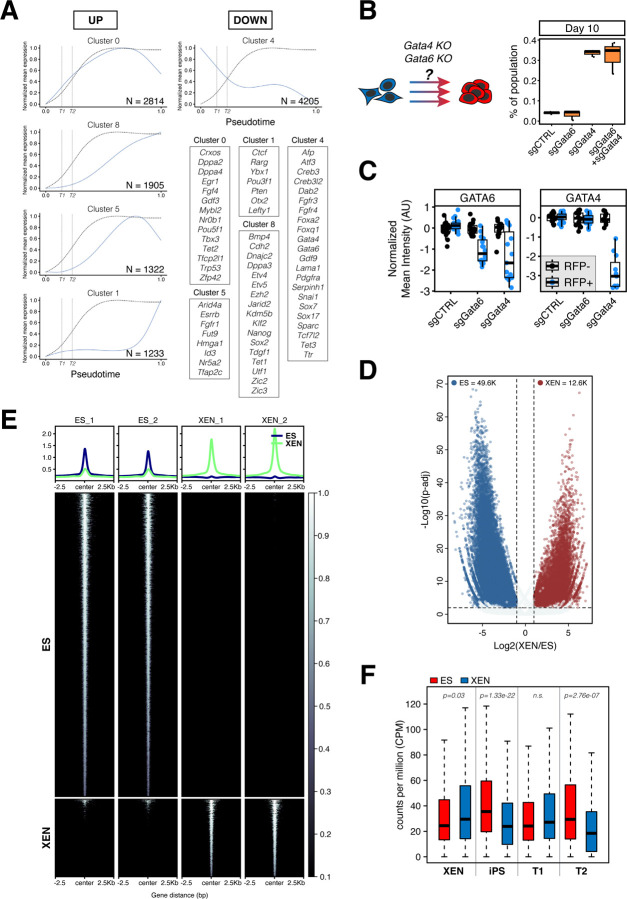
Figure 5. XEN transcriptional network serves as a roadblock to successful XEN-to-iPS reprogramming.
(A) Gene expression waves over pseudotime of XEN-to-iPS reprogramming. Plots show mean expression trend of all genes within each cluster. Dotted curve represents the probability of acquiring the T3/iPS state. Vertical dotted lines indicate T1 and T2 terminals states along the pseudotime axis. Representative genes for each cluster are highlighted in boxes.
(B) Reprogramming efficiency following Gata4 and/or Gata6 perturbation. Reprogrammable XEN cells were transfected with plasmids constitutively expressing Cas9 and sgRNAs targeted to Gata4 and/or Gata6, or control sgRNA. Cells were plated in reprogramming conditions for 10 days and resulting percentage of iPS-like cells was determined using flow cytometry. (Right) Box plots showing the proportion of the entire population that were S+O+P- at day 10 of reprogramming. Middle line marks the median; lower and upper hinges correspond to the first and third quartiles, respectively. Whiskers extend to 1.5*interquartile range (IQR) from the hinge. Outliers are represented by open circles. N = 3.
(C) Box plots showing relative reduction in anti-GATA4 or anti-GATA6 fluorescence immunostaining in XEN cells transfected with Cas9/sgRNA expression vectors targeting Gata4 or Gata6, or non-target control. Individual points represent relative fluorescence intensity in individual cells represented as arbitrary units and normalized to untransfected (RFP-) cells within the same well (see images in Figure S6C).
(D) Volcano plot of significantly differential accessible ATAC-seq peaks in XEN versus ES cells.
(E) Tornado plots of ATAC-seq signal in XEN and ES cells. The ATAC-seq signals are shown for 2.5kb up- and downstream of peak centers.
(F) Box plots showing relative chromatin accessibility in XEN and ES cells of genes enriched in XEN, XEN-iPS, T1 and T2 terminal states.

