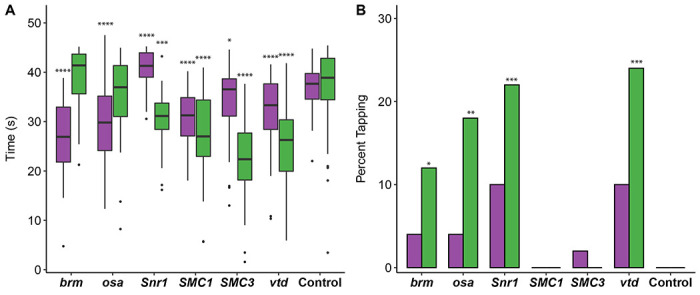
Figure 1. Altered startle response phenotypes in SSRIDD and CdLS fly models.

Startle phenotypes of flies with Ubi156-GAL4-mediated RNAi knockdown. (A) Boxplots showing the time, in seconds, spent moving after an initial startle force. Asterisks represent sex-specific pairwise comparisons with the control. (B) Bar graphs showing the percentage of flies that exhibit tapping behavior (see File S1 and S2) following an initial startle stimulus. Females and males are shown in purple and green, respectively. See Table S4 for ANOVAs (A) and Fisher’s Exact Tests (B). N = 36-50 flies per sex per line. *: p < 0.05, **: p < 0.01, ***: p < 0.001, ****: p < 0.0001.
