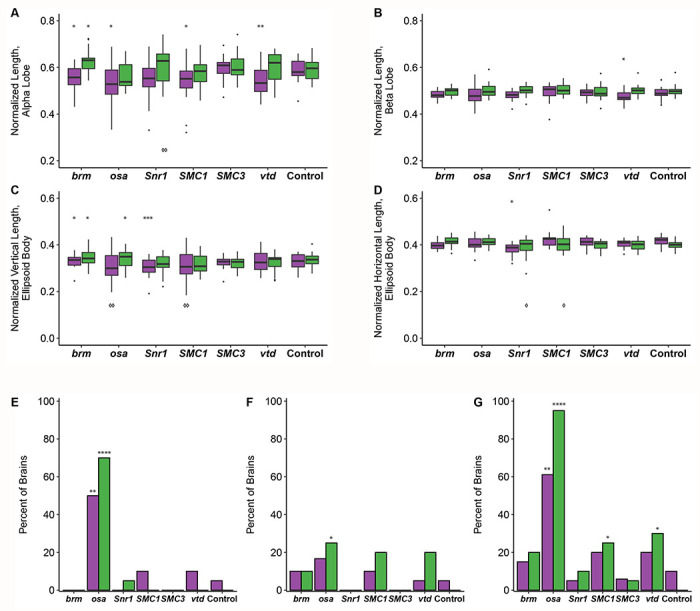
Figure 4. SSRIDD and CdLS fly models show gene-specific changes in mushroom body and ellipsoid body.

Boxplots showing (A) the average alpha lobe and (B) beta lobe length for each brain; (C) ellipsoid body height (vertical direction; dorsal-ventral) and (D) width (left-right; lateral). Bar graphs showing the percentage of brains that (E) have a stunted alpha lobe(s)/narrowed alpha lobe head(s); (F) have a beta lobe(s) crossing the midline, including fused beta lobes; and (G) display one of more of the following defects: skinny alpha lobe, missing alpha lobe, skinny beta lobe, missing beta lobe, stunted alpha lobe/narrowed alpha lobe head, beta lobe crossing the midline/fused beta lobes, extra projections off of the alpha lobe, extra projections off of the beta lobe. See Figure 3. All brains were dissected from flies with Ubi156-GAL4-mediated RNAi knockdown. For panels A-D, brains missing only one alpha or beta lobe are represented by the length of the remaining lobe and brains missing both alpha lobes or both beta lobes were not included in the analyses. For panels E-G, data were analyzed with a Fisher’s Exact test, sexes separately. Asterisks (*) and diamonds (panels A-D only; ⋄) represent pairwise comparisons of the knockdown line versus the control in ANOVAs or Fisher’s Exact tests, and Levene’s tests for unequal variances, respectively. See Table S4 for ANOVAs, Fisher’s Exact and Levene’s Test results. Females and males are shown in purple and green, respectively. N = 17-20 brains per sex per line. *: p < 0.05, **: p < 0.01, ***: p < 0.001, ****: p < 0.0001. ⋄: p < 0.05, ⋄⋄: p < 0.01.
