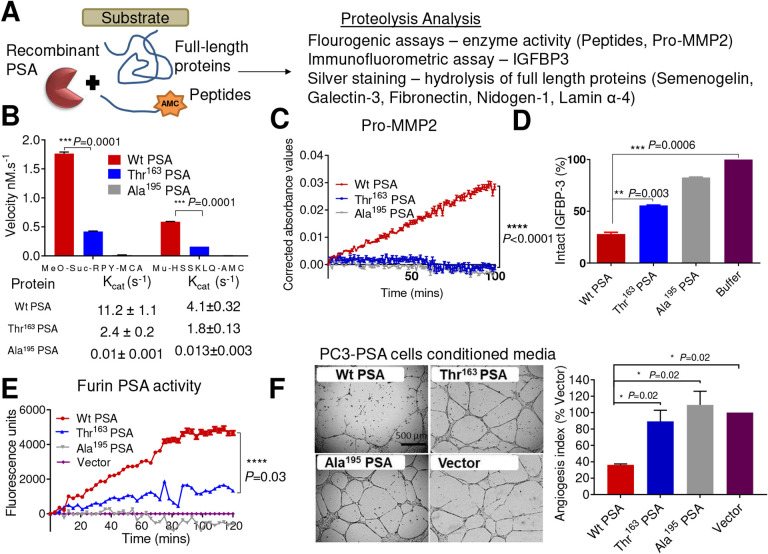
Figure 3.
Biochemical characterization of the effect of the Thr163 variant on PSA activity.
A) Schematic for PSA proteolytic activity analysis. B) Rate of hydrolysis by mature PSA proteins (Wt PSA, Thr163 PSA, and catalytically inactive mutant control Ala195 PSA, all at 0.1 μM) were compared using the peptide substrates MeO-Suc-RPY-MCA (10 μM) and Mu-HSSKLQ-AMC (1 μM) over 4 h at 37°C. Proteolytic activity derived from assaying a constant amount of PSA with increasing concentration (0–250 mM) for these two substrates were used to estimate Kcat values using nonlinear regression analysis in Graphpad Prism. Results are shown as the mean ± SEM from two experiments, each with three replicates (Welch’s t-test ***P=0.0001). Also see Supplementary Figure 5B. C) Time (mins) versus relative absorbance (OD) corrected to the substrate alone controls was plotted indicating the activity of pro-MMP2 (0.14 μM) when pre-incubated with PSA protein variants (Wt, Thr163 and Ala195 at 0.07 μM) at 37°C and then the activity analysed with the chromogenic substrate (Ac-PLG-[2-mercapto-4-methyl-pentanoyl]-LG-OC2H5, 40 μM) for active MMP2 over 2 h. Results are shown as the mean ± SEM of three experiments analysed using Kruskal-Wallis test. ****P<0.0001. D) Intact/total IGFBP-3 (2.2 μM) after 24h incubation at 37°C with PSA variants (0.25 μM) as shown relative to IGFBP-3 control without added PSA. Also see Supplementary Figure 5C. Results are shown as mean ± SEM (n=3, Welch’s t-test, **P=0.003 and ***P=0.0006). E) Fluorescent activity observed for the furin generated active PSA captured from serum free conditioned media of furin-PSA overexpressing PC-3 cells (Wt, Thr163, inactive mutant Ala195 and vector) using the peptide substrate MeO-Suc-RPY-MCA. (n=2, Mean ± SEM *P=0.03). F) Inhibition of HUVEC tube formation on Matrigel by treatment of HUVECs with serum free conditioned media from the PC-3 cells overexpressing (Wt, Thr163 and Ala195 PSA) and PBS control (negative). Scale bar is 500 μm. The graph to the right represents the effect of these PSA protein variants on HUVEC tube formation expressed as an angiogenesis index. The angiogenesis index, reflecting the extent of tube formation or angiogenic potential of the cells 39,53 is shown in relation to the control (mean + SEM, *P=0.02 as compared to control (t-test), n=2). Also see Supplementary Figure 5D.

