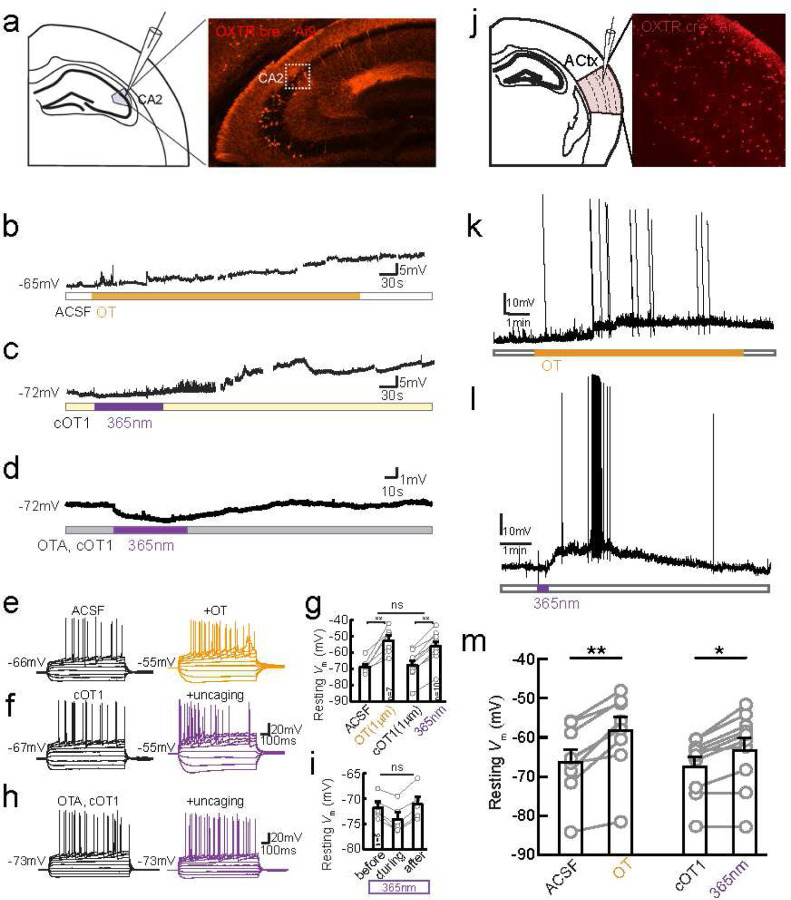
Figure 4. Photo-release of caged oxytocin depolarizes OXTR+ hippocampal CA2 pyramidal neurons and OXTR+ neurons in the auditory cortex.
(a)Schematic of whole-cell recordings from mouse hippocampal brain slices (left), image of a coronal section containing dorsal hippocampus CA2 from OXTRcre∷Ai9 mouse where neurons expressing oxytocin receptors express tdTomato (right).
(b) Example traces of spontaneous activity recorded on current clamp of tdTomato+ pyramidal cell during application of exogenous 1 μM oxytocin (orange bar).
(c) Example traces of spontaneous activity of tdTomato+ dCA2 neuron in the presence of 1 μm cOT1 and UV light stimulation (purple bar).
(d)Example traces of spontaneous activity recorded on current clamp of tdTomato+ pyramidal cell in bath solution containing 10 μm OTA and 1 μM cOT1, and photo-stimulation was applied using 365 nm UV light (purple bar).
(e) Example traces of firing patterns of CA2 OXTR+ pyramidal cell induced by steps of current injection (−200Δ40pA) before (black) and after (orange) application of 1 μM oxytocin
(f) Example traces of firing patterns before (black) and after UV photo-uncaging of cOT1 (purple).
(g) Pooled data of resting membrane potential (Vm) quantified at the 15th minute since oxytocin in or light-on respectively. Gray dots represent individual cells. Bar graphs represent Mean ± SEM: in ACSF application of oxytocin depolarized CA2 neurons from −68.43±1.59 to −52.14±2.89, n=7, p=0.0009, paired t-test; UV light-mediated uncaging depolarized CA2 neurons from −67.55±2.53 to −55.89±2.90, n=10, p<0.0001, paired t-test. Photo-uncaging depolarized CA2 neurons to a similar extent as did oxytocin, F (1, 23) = 0.2962, p=0.5915, Two-way ANOVA.
(h) Firing patterns of CA2 cell in the presence of OTA and cOT1, before (black) and after (purple) 365 nm UV light stimulation.
(i) Pooled data of resting membrane potential (Vm). Gray dots represent individual cells. Bar graphs represent Mean ± SEM: before, during and after 365 nm LED light stimulation the Vm was −71.6±1.04, −74.17±1.15, and −71.02±1.43 mV, F (2, 12) = 1.900, p=0.1919, One-way ANOVA.
(j) Schematic of slice recordings (right), image of a section of left auditory cortex from OXTRcre∷Ai9 mouse where neurons expressing oxytocin receptors express tdTomato (left).
(k) Summary graph of peak depolarization of OXTR+ neurons for oxytocin (left) and caged oxytocin (cOT1) (right). Photorelease of caged oxytocin (cOT1) causes significant membrane depolarization of OXTR+ neurons (n=10 neurons, p =0.0013, paired t-test) and compares well (n.s. difference, unpaired t-test) with the pharmacological application of oxytocin which produces significant membrane depolarization of OXTR+ neurons (p = 0.0003, paired t-test).
(l) Example trace of continuous current clamp recording from OXTR+ neuron (red) and OXTR− neuron (black) with oxytocin peptide. Example trace of continuous current clamp recording from OXTR+ neuron (black) and OXTR− neuron (grey) with caged oxytocin (cOT1), pulsed with UV light (365 nm LED) for uncaging at the purple arrow.
(m)Example trace of continuous current clamp recording from OXTR+ neuron (black) and OXTR− neuron (grey) with caged oxytocin (cOT1), pulsed with UV light (365 nm LED) for uncaging at the purple arrow.
* p<0.05, ** p<0.01

