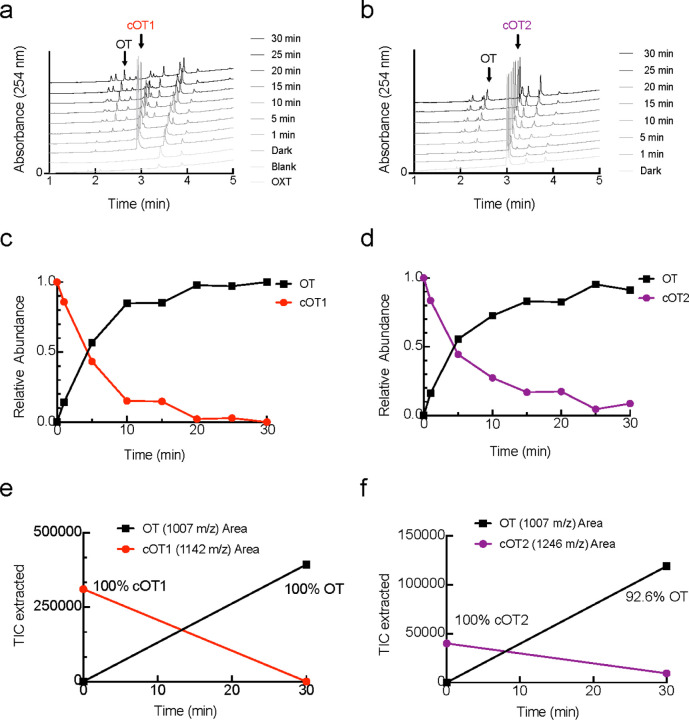
Extended Data Figure 2. Analysis of Uncaging of cOT1 and cOT2 using LC-MS.
(a-b) Representative LC-MS traces for cOT1 (a) and cOT2 (b) show increase in oxytocin and decrease in photocaged oxytocin upon 365 nm irradiation. OT: LC-MS tR = 2.19 min (5–100% MeCN in H2O, 0.1% formic acid, 254 nm detection), LRMS (ESIP) for C43H67N12O12S2+ [M+H]+: calcd.: 1007.4, found 1007.4. cOT1: LC-MS tR = 2.82 min (5–100% MeCN in H2O, 0.1% formic acid, 254 nm detection), LRMS (ESIP) for C50H72N13O14S2+ [M+H]+: calcd.: 1142.48, found 1142.5. cOT2: LC-MS tR = 2.97 min (5–100% MeCN in H2O, 0.1% formic acid, 254 nm detection), LRMS (ESIP) for C53H76N13O18S2+ [M+H]+: calcd.: 1246.5, found 1246.5.
(c-d) Plot of photo-uncaging of cOT1 (c) and cOT2 (d).
(e-f) After 20 min full uncaging of cOT1 (e) is observed. After 30 min, 92.6% of cOT1 (f) uncaging observed.

