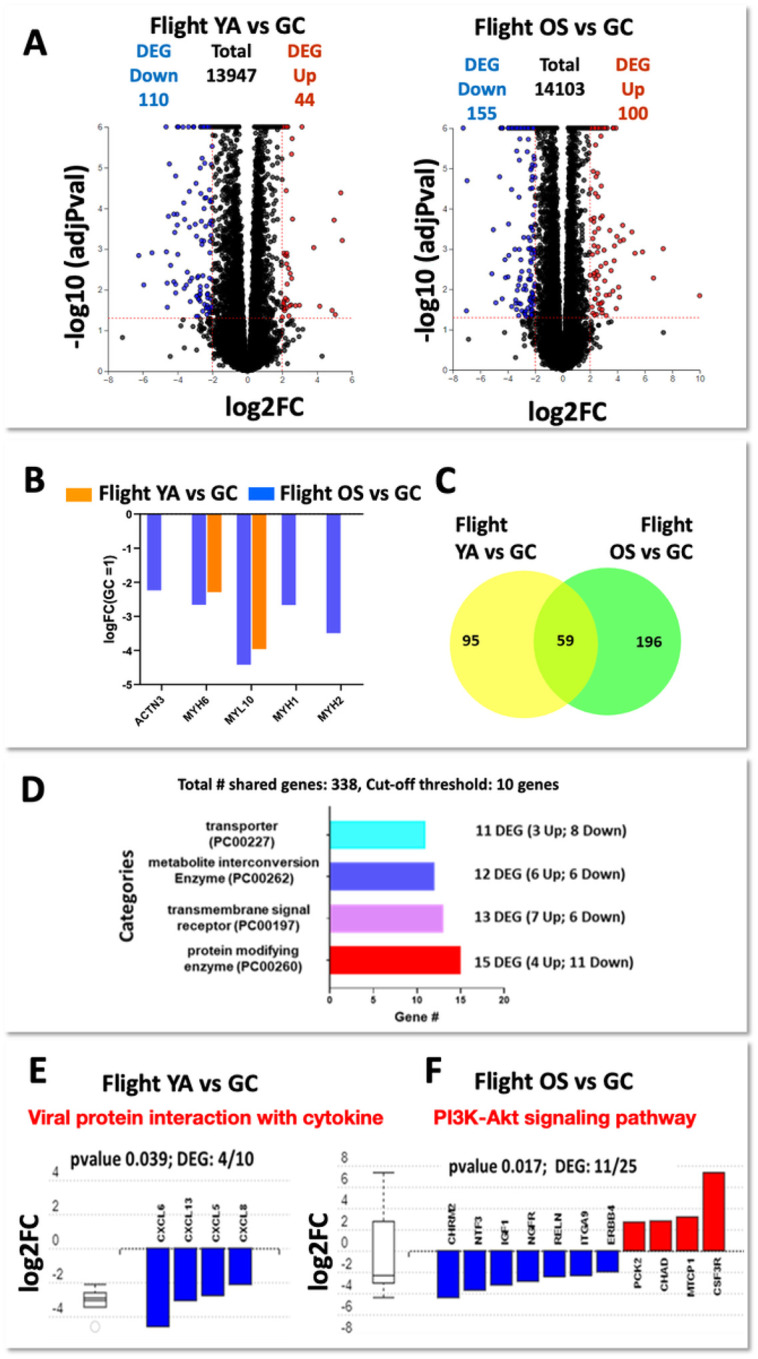
Figure 2.

Transcriptional responses of muscle myobundles during flight and ground culture. a, Volcano plots. Differential expressed genes between flight and ground controls for YA (left panel) or OS (right panel). Red: significantly up-regulated genes in flight. Blue: significantly down-regulated genes. Significance determined according to log2 fold change with threshold set at ±2 and -log10 p-value ≤0.05. b. Comparative analysis of differential gene expression changes between flight and ground controls of genes involved in muscle myogenesis and contraction YA (orange bars) and OS (blue bars). c. Venn diagrams. Overlapping and distinct DEGs among Flight YA vs GC and Flight OS vs GC datasets. d. Panther classification system of the 59 shared genes shown in the Venn diagram. The horizontal bar chart identifies the four protein classes and relative number of DEGs of each functional class by applying a cut-off threshold of 10 genes. e. f. Significantly enriched KEGG pathways in response to flight either in YA- or OS-derived myobundles relative to their respective ground controls.
