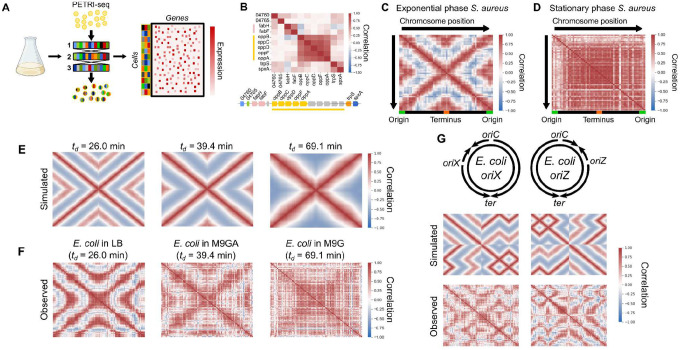
Figure 1: scRNA-seq reveals a global pattern of replication-associated gene covariance.
A) PETRI-seq workflow20. Bacterial cells were fixed and permeabilized, then subjected to three rounds of cDNA barcoding to give transcripts of each cell a unique barcode combination. This method is highly scalable to multiple samples and tens of thousands of cells. B) Local operon structure is captured by gene-gene correlations (Spearman’s r). Operons are indicated by shared colors of genes. Gray genes indicate those removed by low-count filtering. Names of SAUSA300_RS04760 and SAUSA300_RS04765 are truncated. C & D) Global gene-gene correlations reflect chromosomal position in (C) exponential phase and (D) stationary phase S. aureus. Spearman correlations were calculated based on scVI-smoothed expression averaged in 50 kb bins by chromosome position. E) Simulated correlation patterns in unsynchronized E. coli populations at three different growth rates. F) Spearman correlations between scaled data averaged into 50 kb bins, as for (C) but for E. coli grown at three growth rates. G) Introducing ectopic origins of replication in E. coli leads to predictable perturbations in gene expression heterogeneity. Top: schematic of predicted replication patterns based on previous studies25–27. Middle: Predicted correlation patterns based on the copy number simulation. Bottom: Real correlation patterns in oriX and oriZ mutant strains, as in (C). Heatmaps of correlations without chromosome position-dependent binning are shown in Fig. S2D.

