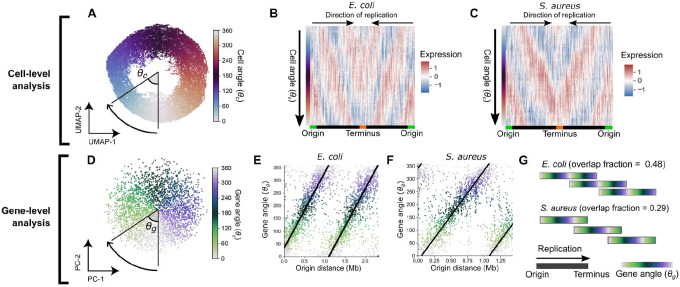
Figure 2: Ordering expression by cell angle and gene angle provides a quantitative description of cell cycle gene expression.
A) UMAP of LB-grown E. coli with expression averaged in 100 kb bins by chromosome position. Cell angle θc is the angle between UMAP dimensions relative to the center. For UMAP without averaging, see Fig. S7A. B & C) Heatmap of scaled gene expression in E. coli (B) or S. aureus (C) averaged in 100 bins by θc. D) Derivation of gene angle θg in LB-grown E. coli. Principal component analysis was performed on the transpose of the matrix in (B), and θg was defined as the angle between principal components (PCs) 1 and 2. Genes form a wheel in UMAP (Fig. S7C). E & F) The relationship between θg and origin distance for E. coli grown in LB (E) and S. aureus grown in TSB (F). G) Predicted replication patterns in LB-grown E. coli (td = 26.0 ± 1.3 min) and S. aureus (td = 24.9 ± 0.6 min). Overlapping rounds of replication lead to shared θg in simultaneously-replicated chromosomal regions. Note that greater overlap in replication rounds is observed for E. coli than for S. aureus.

